
MACD Trading Strategy: Signals, Settings and Examples
Most traders have heard of MACD. Few use it well. It sits on the chart. Two lines and some bars, People glance at it. They guess. They lose money here is the truth. The MACD trading strategy is not complicated but it is not simple either. It measures momentum. It shows when trends are speeding up or slowing down. It gives signals. Some are good, some are traps.
The difference is knowing what to look for. This guide breaks it all down. The lines. The histogram. The crossovers. The divergences. Real examples. Settings that work. And how to avoid the false signals that catch most beginners.
What Is the MACD?
MACD stands for Moving Average Convergence Divergence. It was developed by Gerald Appel in the late 1970s . It is both a trend-following indicator and an oscillator. It measures the relationship between two exponential moving averages (EMAs) of price.
The standard settings are 12, 26, and 9. The 12-period EMA tracks short-term momentum. The 26-period EMA tracks the longer trend. The 9-period EMA is the signal line .
Read More: How to Find Good Stocks for Trading: A Simple Beginners Guide
The Three Components
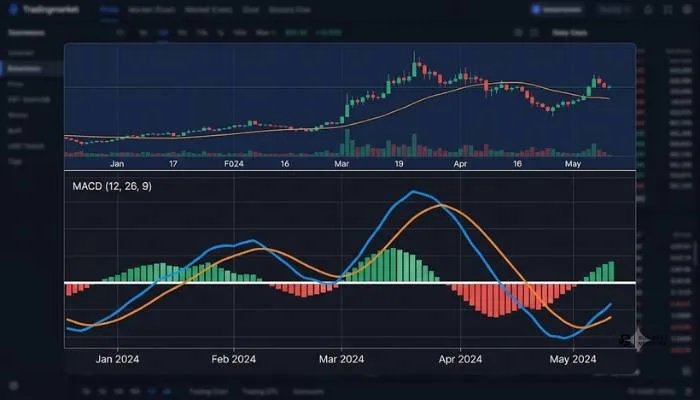
- MACD Line: The difference between the 12-period EMA and the 26-period EMA. When the 12 EMA is above the 26 EMA, the MACD line is positive. When it is below, the MACD line is negative .
- Signal Line: A 9-period EMA of the MACD line. This line is slower and smoother. Crossovers between the MACD line and the signal line generate trade signals .
- Histogram: The difference between the MACD line and the signal line. It shows momentum visually. Growing bars mean momentum is strengthening. Shrinking bars mean momentum is fading .
How to Read the MACD Indicator?
The MACD gives you several types of information at once.
Zero Line Crosses
When the MACD line crosses above zero, it suggests bullish momentum. When it crosses below zero, it suggests bearish momentum . This is a slower signal. It confirms the broader trend direction.
Signal Line Crossovers
When the MACD line crosses above the signal line, it is a bullish crossover. This is a potential buy signal. When it crosses below, it is a bearish crossover. This is a potential sell signal .
Histogram Analysis
The histogram shows the distance between the MACD line and the signal line. Expanding bars mean the trend is getting stronger. Contracting bars mean it is losing steam . The histogram can also warn you before a crossover happens.
Divergence
Divergence occurs when price and MACD move in opposite directions. If price makes a higher high but MACD makes a lower high, that is bearish divergence. It warns that upward momentum is fading. If price makes a lower low but MACD makes a higher low, that is bullish divergence. It warns that downward momentum is fading .
MACD Settings for Day Trading
The default 12, 26, 9 settings work well for swing trading on daily and 4-hour charts. They were designed for that timeframe . But on shorter timeframes, these settings lag too much. The signal comes too late.
For day trading on 5-minute, 15-minute, or 1-hour charts, traders often use faster settings. The 8, 17, 9 setup is a popular choice. It reduces lag while still filtering out some noise . Some traders use 6, 13, 5 for even faster signals, but this produces more false signals .
There is no single best setting. It depends on your timeframe, your trading style, and the market you are trading. Test different settings on historical data before using them with real money.
MACD Trading Strategy with Examples
Strategy 1: The Crossover Strategy
This is the simplest MACD strategy. You buy when the MACD line crosses above the signal line. You sell when it crosses below .
Example: On a 4-hour chart, the MACD line crosses above the signal line while both lines are below zero. This is an early bullish signal. If price then breaks above a key resistance level with strong volume, the signal is confirmed. You enter a long position. Your stop loss goes below the recent swing low .
The problem with this strategy is false signals. In sideways markets, the lines cross back and forth repeatedly. You get whipsawed. That is why confirmation is essential.
Strategy 2: Divergence Strategy
This strategy looks for disagreement between price and MACD. A bearish divergence forms when price makes a higher high but MACD makes a lower high. A bullish divergence forms when price makes a lower low but MACD makes a higher low .
Example: A stock is trending upward. Price hits a new high at $110. But the MACD line makes a lower high than its previous peak. This is bearish divergence. It warns that buyers are losing strength. You wait for confirmation. A bearish engulfing candle forms at the top. You enter a short position. Your stop loss goes above the reversal candle .
Divergence alone is not enough. Always wait for price action to confirm the reversal.
Strategy 3: MACD + RSI Confirmation
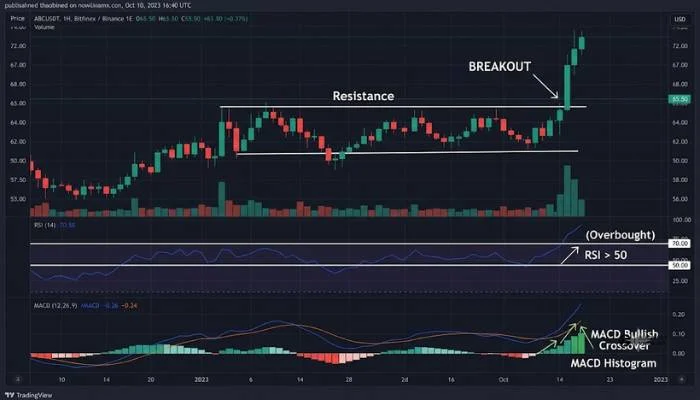
Using MACD alone produces false signals. Combining it with the Relative Strength Index (RSI) filters out many bad trades. RSI measures momentum speed. MACD measures trend direction. Together they give a fuller picture .
Example: The MACD line crosses above the signal line. But RSI is still below 50, showing weak momentum. You wait. Later, the MACD crosses again. This time RSI is above 50 and rising. Price breaks above resistance. Volume increases. This is a stronger signal. You enter the trade .
RSI also serves as a risk management tool. If you enter on a MACD crossover but RSI fails to hold above 50, you exit. The trade is not working .
You May Also Read: Trader Talk Pullback Meaning: Simple Guide to Trading Pullbacks
MACD Trading Strategy Chart
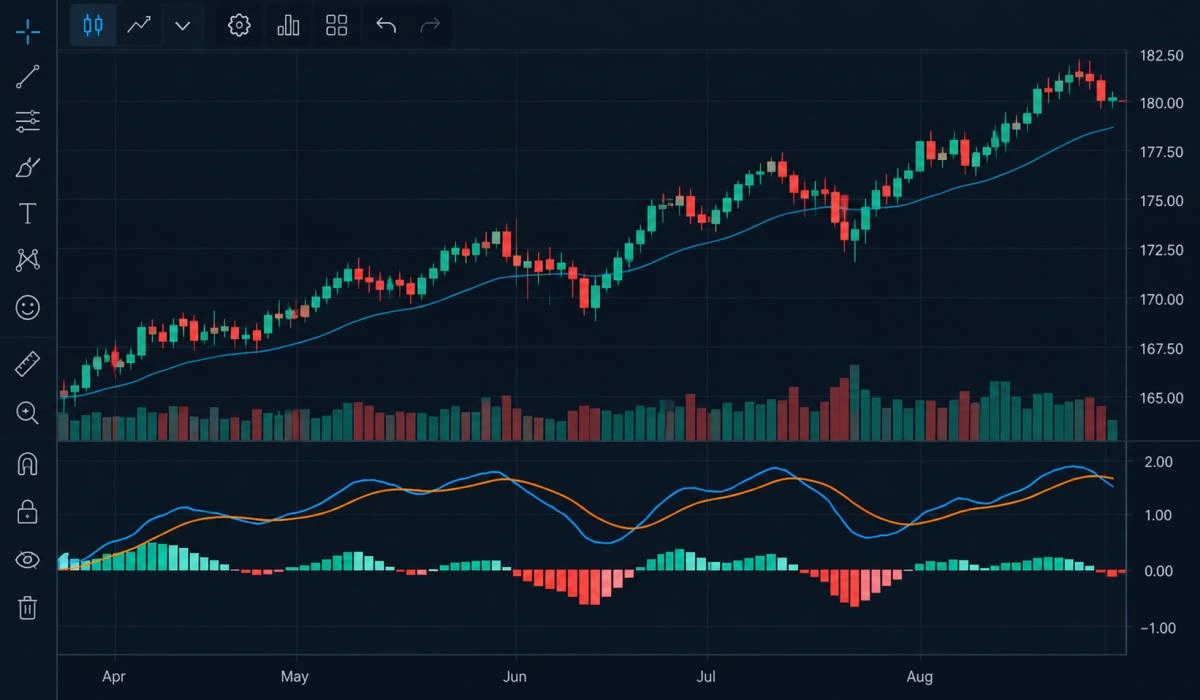
- On a chart, you will see the MACD in a separate panel below the price. The MACD line and signal line move together. The histogram shows their distance.
- When the MACD line is above the signal line, the histogram is positive. When it is below, the histogram is negative. The zero line is the center. Crosses above zero suggest bullish momentum. Crosses below suggest bearish momentum .
- The best charts for MACD trading show clear trends. Avoid choppy, range-bound markets. The MACD performs poorly in those conditions .
MACD Indicator Buy and Sell Signals
Here is a summary of the key signals.
Buy Signals:
- MACD line crosses above the signal line (bullish crossover)
- MACD line crosses above zero
- Bullish divergence (price lower low, MACD higher low)
- Histogram turns positive and expands
Sell Signals:
- MACD line crosses below the signal line (bearish crossover)
- MACD line crosses below zero
- Bearish divergence (price higher high, MACD lower high)
- Histogram turns negative and expands
Remember, no signal is 100% reliable. The MACD is a tool, not a guarantee. Always use stop losses. Always consider the broader trend and market context.
FAQs
1. What is the MACD trading strategy?
It is a method that uses the MACD indicator to find buy and sell points. The main signals are crossovers between the MACD line and signal line, zero line crosses, and divergences between price and MACD .
2. What are the best MACD settings for day trading?
The default 12, 26, 9 settings lag on short timeframes. Day traders often use 8, 17, 9 for 5-minute to 1-hour charts. This reduces lag while still filtering noise .
4. What does MACD divergence mean?
Divergence happens when price and MACD move in opposite directions. Bearish divergence warns of a possible downturn. Bullish divergence warns of a possible upturn. It signals weakening momentum .
5. Can I use MACD for crypto trading?
Yes. MACD works on any market with price data. Crypto traders use the same signals: crossovers, zero line crosses, and divergences. The 12, 26, 9 settings are common for 4-hour and daily charts .
6. Why does MACD give false signals?
MACD is a lagging indicator. It reacts to price after the move has started. In sideways markets, the lines cross repeatedly, creating whipsaws. Always confirm signals with price action or other indicators .