
How to Use the ATR Indicator: A Simple Trading Guide
The ATR is one of the most misunderstood tools in trading. Most people think it tells you where the price is going. It does not. The ATR tells you how much the price is moving. That is a big difference. Once you understand this, you can use it to set smarter stop-losses and size your positions correctly.
This guide explains how to use the ATR indicator in simple words. You will learn what ATR is. You will learn how to calculate ATR in trading. You will also learn how to find ATR in TradingView. No complicated jargon. Just clear steps that work.
What Is the ATR Indicator?
ATR stands for Average True Range. It was created by J. Welles Wilder in 1978 . It measures volatility. That is it. It does not tell you if the trend is up or down. It just tells you how much the price is swinging.
The ATR is calculated using the True Range. The True Range takes the largest of three numbers :
- Current high minus current low
- Current high minus previous close
- Current low minus previous close
The ATR then takes the average of these True Range values over a set period. The default is 14 periods .
Read More: MACD Trading Strategy: Signals, Settings and Examples

How to Calculate ATR in Trading?
You do not need to do this by hand. Your charting platform does it for you. But knowing the formula helps you understand what the line means.
The first ATR value is a simple average of the first 14 True Range values. After that, the formula is:
ATR = [(Previous ATR × 13) + Current TR] / 14
This smooths the line. It makes it easier to read. A rising ATR means volatility is increasing. A falling ATR means volatility is decreasing .
How to Use the ATR Indicator?
The ATR is not a buy or sell signal. It is a risk management tool. Here is how traders actually use it.
1. Set Volatility-Based Stop-Losses
- This is the most common use. A fixed stop-loss (like 2% below your entry) ignores market conditions. In a volatile market, you get stopped out too early. In a quiet market, your stop is too wide.
- ATR fixes this. You set your stop at a multiple of the ATR. A common multiplier is 1.5 or 2 .
Example: You buy a stock at 100. The ATR is 2. You use a 1.5 multiplier. Your stop-loss is 100 minus (1.5 × 2) = 97 . If volatility rises, the ATR rises, and your stop moves further away. This gives the trade room to breathe.
2. Size Your Positions Correctly
Position sizing is about risk. You should never risk more than 1-2% of your capital on one trade. The ATR helps you calculate how many shares to buy.
Formula: Position Size = (Account Risk ÷ ATR Stop Distance)
If your account is 1,00,000 and you risk 1% (1,000), and your stop distance is 3 (1.5 × ATR of 2), you buy 1,000 ÷ 3 = 333 shares. This keeps your risk consistent, even when volatility changes.
3. Identify Overextended Moves
The ATR can tell you when a move has gone too far, too fast. If the day's range has already covered more than 100% of the ATR, the market may be exhausted. A reversal or pullback is more likely .
This does not mean you should trade against the trend. It means you should be cautious about entering late. Do not chase a move that has already used up its average daily range.
How to Find ATR in TradingView?
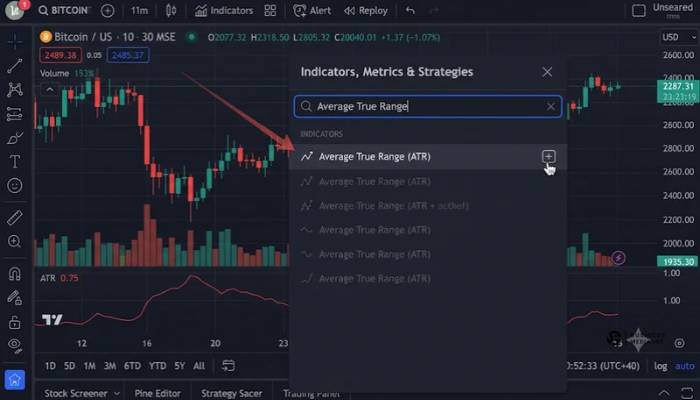
TradingView has the ATR built in. You do not need to code anything.
Step 1: Open any chart.
Step 2: Click "Indicators" at the top.
Step 3: Search for "Average True Range".
Step 4: Click on it. The ATR line will appear in a new pane below the price chart.
You can change the period in the settings. The default is 14. You can also choose the smoothing method (RMA, SMA, EMA, WMA). RMA is the standard .
There are also custom ATR indicators on TradingView. Some show ATR levels plotted directly on the chart. These can help you visualize where the price might stop or reverse .
Best ATR Indicator TradingView
The built-in ATR is enough for most traders. But if you want more, look for these:
- ATR Stop-Loss & Risk Manager: This indicator plots ATR-based stop levels on your chart. It also shows a risk table. It is good for traders who want a visual guide .
- ATR Plots + Overlay: This shows ATR levels relative to the open price. It also shows a "coverage %" so you can see how much of the ATR has already been used .
- ATR Extension to SMA50: This measures how far the price is from its 50-day moving average in ATR terms. It helps identify exhaustion zones .
Do not overload your chart. One ATR tool is enough. The built-in ATR plus a simple multiplier calculation works for most people.
You May Also Read: How to Find Good Stocks for Trading: A Simple Beginners Guide
Quick Summary Table
| Use Case | How to Use ATR |
|---|---|
| Stop-Loss | Entry ± (Multiplier × ATR) |
| Position Sizing | Account Risk ÷ (Multiplier × ATR) |
| Volatility Check | Rising ATR = more volatility |
| Overextension | Day range > 100% of ATR = caution |
| TradingView | Indicators > Average True Range |
FAQs
1. What is the ATR indicator in simple words?
ATR measures how much a stock or asset moves in a given period. It does not tell you the direction. It only tells you the size of the moves. High ATR means big swings. Low ATR means small swings .
2. How do I calculate ATR in trading?
You do not need to. Your platform calculates it. The formula takes the average of the True Range over 14 periods. The True Range is the largest of: high minus low, high minus previous close, or low minus previous close .
3. How do I find ATR in TradingView?
Click Indicators. Search for "Average True Range". Click it. The ATR line appears below the price chart. You can change the period in settings .
4. What is the best ATR indicator on TradingView?
The built-in ATR is best for most traders. For visual stop-loss levels, try "ATR Stop-Loss & Risk Manager". For overextension checks, try "ATR Pots + Overlay" .
5. How do I use ATR for stop-loss?
Place your stop at a multiple of the ATR. A common multiplier is 1.5 or 2. For a long trade, stop = entry price minus (1.5 × ATR). This adjusts to market volatility .
6. Can ATR tell me the trend direction?
No. ATR is non-directional. A rising ATR can happen in an uptrend or a downtrend. It only measures volatility, not direction .
7. What is a good ATR multiplier?
1.5 is a common default for moderate volatility. Use a larger multiplier for wider stops (swing trading). Use a smaller multiplier for tighter stops (day trading) .
8. How does ATR help with position sizing?
It tells you how wide your stop needs to be. Then you divide your risk amount by the stop distance. This gives you the number of shares to buy. It keeps your risk consistent across different volatility conditions .