

PE Ratio vs PB Ratio Stocks: Key Differences Every Investor Should Know
Do you want to know if a stock is cheap or expensive? Two ratios help you find out. PE ratio and PB ratio are the most common tools used by investors. But they measure different things. PE ratio tells you how much you pay for a company's earnings. PB ratio tells you how much you pay for its net assets.
Using the wrong one can lead you to bad decisions. This guide explains PE ratio vs PB ratio stocks in simple words. You will learn when to use each ratio. You will also learn what is a good PB ratio. No complicated jargon. Just clear information to help you value stocks correctly.
What is PE Ratio?
PE ratio stands for Price-to-Earnings ratio. It tells you how much investors are willing to pay for every rupee of a company's earnings .
Formula: PE Ratio = Market Price per Share ÷ Earnings per Share (EPS)
If a stock trades at 100 and its EPS is 5, the PE ratio is 20. This means investors pay 20 for every 1 of earnings .
What PE Ratio Tells You
- A high PE ratio means investors expect strong future growth. They are willing to pay more today for profits that will come later. Tech companies often have high PE ratios for this reason .
- A low PE ratio means the stock may be undervalued. Or it could mean the market expects earnings to decline. You need to check why the PE is low before buying .
PE Ratio in Indian Stocks
In India, NSE calculates PE ratios using consolidated earnings from the last four quarters. Consolidated earnings include profits from subsidiaries. Standalone earnings only include the parent company. This difference matters when comparing stocks .
Read More: Nifty 50 vs Individual Stocks for Beginners: Which Is Better?

What is PB Ratio?
PB ratio stands for Price-to-Book ratio. It compares a company's market value to its book value. Book value is what would be left if the company sold all assets and paid all debts .
- Formula: PB Ratio = Market Price per Share ÷ Book Value per Share
- Book Value = Total Assets – Total Liabilities
If a stock trades at 150 and its book value per share is 100, the PB ratio is 1.5. This means investors pay 1.50 for every 1 of net assets .
What PB Ratio Tells You?
- A PB ratio below 1 means the market values the company at less than its net assets. This can signal undervaluation. But it can also mean the assets are not worth what the balance sheet shows .
- A high PB ratio means investors believe the company can generate strong returns from its assets. Tech companies often have high PB ratios because their value comes from intangible assets like software and brand, not physical assets .
PE Ratio vs PB Ratio: Key Differences
What They Measure
PE ratio measures how much you pay for earnings. PB ratio measures how much you pay for net assets .
When to Use PE Ratio?
- PE ratio works best for companies with stable earnings. It is useful for most sectors. But it can mislead for cyclical companies like steel or cement. At the peak of a cycle, earnings are high and PE looks low. But the cycle may be about to turn .
- PE ratio also fails for companies with negative earnings. You cannot calculate a meaningful PE when EPS is negative .
When to Use PB Ratio?
- PB ratio works best for asset-heavy businesses. Banks, insurance companies, and manufacturers have large tangible assets. For these sectors, PB ratio is more reliable than PE .
- Bank profits can be distorted by loan loss provisions. Net worth (book value) is more stable. This is why analysts use PB ratio for banks .
- PB ratio does not work well for tech companies. Their value comes from intellectual property, research, and brand. These assets do not appear fully on the balance sheet .
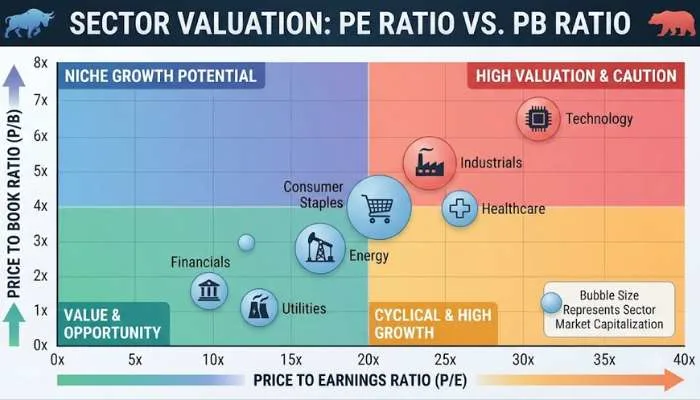
PE Ratio vs PB Ratio Chart: How to Compare Stocks
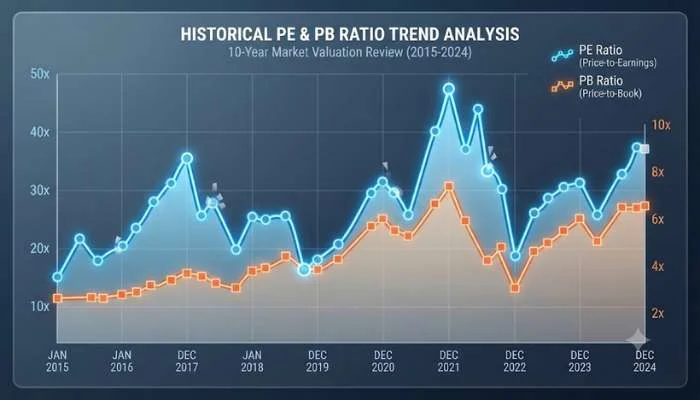
You can use charts to compare these ratios across companies. Here is how to read them .
- PE Ratio Chart: Shows how expensive a stock is relative to its earnings over time. If today's PE is at a 5-year low, the stock may be cheap compared to its own history.
- PB Ratio Chart: Shows how the market values a company's assets over time. A PB ratio below its historical average may signal undervaluation.
- Compare within sectors: A PE of 30 might be cheap for a tech company but expensive for a utility. Always compare ratios within the same industry .
What is a Good PB Ratio?
There is no universal answer. It depends on the sector .
- For banks and financial companies: PB ratios between 1 and 3 are common. A PB below 1 may signal undervaluation. A PB above 3 may signal overvaluation .
- For manufacturing and real estate: PB ratios between 1 and 3 are reasonable. These companies have tangible assets that back the book value .
- For tech and service companies: PB ratios are often above 3. These companies have few physical assets. Their value comes from intangible assets. A high PB does not mean overvalued .
- For FMCG companies: PB ratios of 1 to 2 are considered fair in India .
A good PB ratio depends on the company's return on equity (ROE). Companies with high ROE can justify higher PB ratios. Companies with low ROE should trade at lower PB ratios .
PE Ratio vs PB Ratio Stocks List: Indian Examples
Here are some real examples from Indian markets :
| Company | TTM PE | PB Ratio |
|---|---|---|
| Page Industries | 52.36 | 26.34 |
| Arvind Ltd | 35.27 | 3.53 |
| Pearl Global | 35.51 | 7.66 |
| Safari Industries | 44.43 | 6.58 |
| Campus Activewear | 45.28 | 7.70 |
| Gokaldas Exports | 56.75 | 2.71 |
| Raymond Lifestyle | 102.02 | 0.46 |
| VIP Industries | -11.57 | 15.13 |
Notice how PE and PB ratios differ across companies. Page Industries has a high PB of 26.34 because it is an asset-light business with strong brand value. Raymond Lifestyle has a low PB of 0.46, which may signal undervaluation or asset concerns.
PE Ratio vs PB Ratio Stocks NSE: Key Points
- NSE calculates index PE and PB ratios usin consolidated financials. This includes subsidiary earnings and net worth. The exchange uses free-float market capitalization for weighting .
- In 2023, NSE changed its PB calculation method. It moved from standalone to consolidated book value. This made the Nifty 50 PB ratio drop from 4.31 to 3.45 overnight. The underlying fundamentals did not change. Only the calculation method changed .
- This is important to know. When comparing historical PB ratios, make sure the data uses the same method.
You May Also Read: NSE Stock Market Holidays 2026: Trading Dates and Holiday List
Quick Summary Table
| Feature | PE Ratio | PB Ratio |
|---|---|---|
| Measures | Price vs earnings | Price vs net assets |
| Formula | Price ÷ EPS | Price ÷ Book Value |
| Best for | Stable earnings companies | Asset-heavy companies |
| Not good for | Cyclical stocks, negative earnings | Tech, service companies |
| Good level | Depends on sector and growth | 1-3 for most sectors |
| Banking use | Less reliable | More reliable |
FAQs
1. What is the main difference between PE and PB ratio?
PE ratio measures how much you pay for a company's earnings. PB ratio measures how much you pay for its net assets. PE is about profits. PB is about asset value.
2. Which is better for stock valuation?
It depends on the sector. PE ratio works for most companies with stable earnings. PB ratio is better for banks, insurance, and manufacturing companies with tangible assets.
3. What is a good PE ratio for Indian stocks?
There is no fixed number. A PE of 15-20 is considered average for many sectors. Tech companies often trade at 30-50. Banks trade at 10-15. Always compare within the same sector.
4. What is a good PB ratio?
For banks and financial companies, PB of 1-3 is common. For manufacturing, 1-3 is reasonable. For tech companies, PB can be higher because they have few physical assets.
5. Why do banks use PB ratio instead of PE ratio?
Bank profits can be distorted by loan loss provisions. Net worth (book value) is more stable and reliable. This is why analysts use PB ratio for banks .
6. Can PE ratio be negative?
Yes. If a company has negative earnings, the PE ratio is negative. A negative PE is not useful for valuation. It means the company is losing money.
7. Why do tech companies have high PB ratios?
Tech companies have few physical assets. Their value comes from software, patents, and brand. These do not appear fully on the balance sheet. So book value is low, making PB ratio high .
8. What is the PB ratio for Nifty 50?
NSE calculates Nifty 50 PB using consolidated book value. After the 2023 method change, the PB ratio dropped to around 3.45. It has hovered around 3.5-3.8 since then .