

How to Read Stock Market Trends: A Simple Guide for Beginners
You look at a stock chart. You see lines and colors. It looks confusing you do not know what it means. This is normal for beginners but reading trends is not as hard as it looks. This guide shows you how to read stock market trends in simple words you will learn to spot uptrends and downtrends you will learn about moving averages and trendlines.
You will also learn how to read charts for day trading. No complicated terms Just clear steps that work. Read this guide Practice daily soon you will read charts with confidence.
What Is a Trend?
A trend is the direction of price movement. It is that simple.
An uptrend means prices are going up. A downtrend means prices are going down. A sideways trend means prices are moving in a range. They are not going up or down much. Trends are your friend. If you trade with the trend, you have a better chance of making money. If you trade against it, you struggle.
Read More: PE Ratio vs PB Ratio Stocks: Key Differences Every Investor Should Know
How to Identify a Trend?
You do not need fancy tools. Just look at the chart.
Higher Highs and Higher Lows
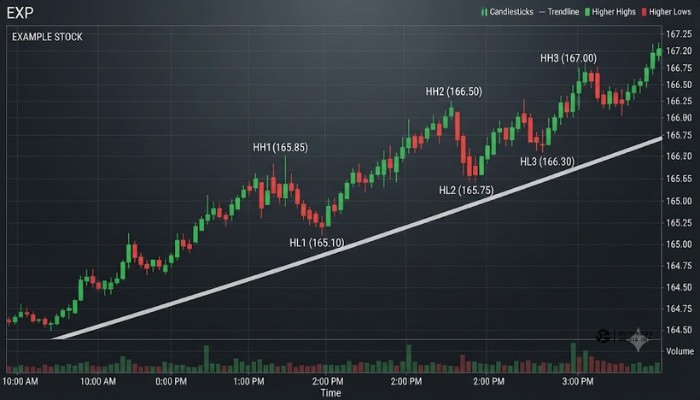
- In an uptrend, each high is higher than the last one. Each low is also higher than the last one. This is called higher highs and higher lows.
- In a downtrend, each high is lower than the last one. Each low is also lower. This is called lower highs and lower lows.
- If you see this pattern, you know the trend.
Moving Averages
- A moving average smooths out price. It shows the average price over a period. The 50-day and 200-day moving averages are common.
- If price is above the moving average, the trend is up. If price is below, the trend is down.
- When the 50-day crosses above the 200-day, it is called a golden cross. This signals an uptrend. When the 50-day crosses below, it is a death cross. This signals a downtrend.
Trendlines
- A trendline connects the lows in an uptrend. Or the highs in a downtrend. It shows the path of the trend.
- In an uptrend, draw a line under the rising lows. In a downtrend, draw a line above the falling highs.
- If price breaks the trendline, the trend may be ending.
How to Read Stock Charts for Day Trading?
Day trading needs a different approach. You look at shorter timeframes. You watch for quick moves.
Timeframes
Day traders use 1-minute, 5-minute, and 15-minute charts. These show more detail. They help you spot quick entries and exits. But do not ignore higher timeframes. Check the daily chart too. It shows the bigger trend. Trade in that direction.
Volume
Volume is the number of shares traded. High volume confirms a move. If price goes up on high volume, the trend is strong. If price goes up on low volume, the move may be weak.
Candlesticks
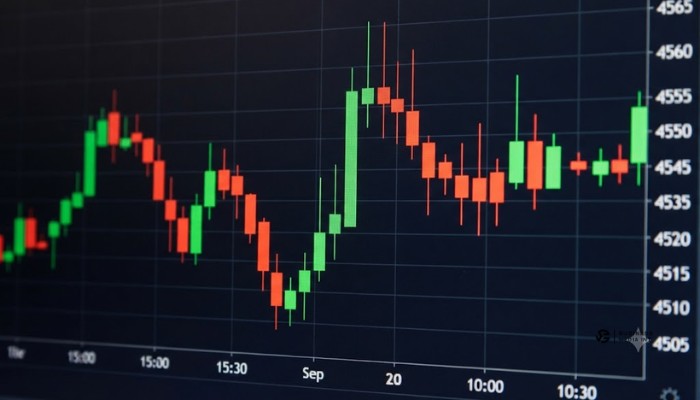
- Candlesticks show price action. Each candle has a body and wicks. The body shows the open and close. The wicks show the high and low.
- A long green body means strong buying. A long red body means strong selling. Small bodies mean indecision.
Support and Resistance
- Support is a price level where buying stops the fall. Resistance is where selling stops the rise.
- In an uptrend, price bounces off support. In a downtrend, price rejects resistance.
How to Read Stock Market Trends for Beginners?
Start simple. Do not try to learn everything at once.
- Step 1: Look at the daily chart. Identify if the trend is up, down, or sideways.
- Step 2: Draw trendlines. Connect the highs or lows.
- Step 3: Add a moving average. Use the 50-day or 200-day.
- Step 4: Check volume. Is it rising or falling?
- Step 5: Find support and resistance. Mark these levels.
That is it. You do not need more.
Stock Chart Reading Practice
The best way to learn is to practice. Open any chart. Ask yourself these questions.
- Is price making higher highs or lower highs?
- Is price above or below the moving average?
- Where are the support and resistance levels?
- Is volume rising or falling?
- What is the overall trend?
Do this daily. After a few weeks, you will read charts naturally.
How to Read Stock Market Trends Free?
You do not need to pay for tools. Many free options exist.
TradingView offers free charts with all indicators. Yahoo Finance shows basic charts. NSE India shows index charts. Investing.com gives free charts and data.
These tools are enough for beginners. Do not buy expensive software until you understand the basics.
You May Also Read: Nifty 50 vs Individual Stocks for Beginners: Which Is Better?

Common Mistakes
- Trading against the trend. If the trend is up, do not short. If the trend is down, do not buy.
- Ignoring volume. Volume confirms price moves. Without it, signals are weak.
- Using too many indicators. You do not need ten indicators. Two or three are enough.
- Not checking higher timeframes. A 5-minute chart may look bullish. But the daily chart may be bearish. Always check the bigger picture.
Quick Summary Table
| Tool | What It Shows |
|---|---|
| Higher Highs/Lows | Trend direction |
| Moving Average | Trend and support/resistance |
| Trendlines | Path of trend |
| Volume | Strength of move |
| Candlesticks | Price action |
| Support/Resistance | Key price levels |
FAQs
1. How do I read stock market trends for beginners?
Open the daily chart. Check if price is making higher highs or lower highs. Higher highs mean uptrend. Lower highs mean downtrend. Add a moving average. See where price sits. That is your first step.
2. How do I read stock charts for day trading?
Use short timeframes. One minute. Five minutes. Fifteen minutes. Watch volume closely. Look for candlestick patterns. Mark support and resistance. Always check the daily chart too. Do not trade against the bigger trend.
3. What is the best indicator for reading trends?
Moving averages work well. The 50-day and 200-day are common. Trendlines also help. You do not need ten indicators. Two or three are enough.
4. How can I practice reading stock charts?
Open any chart every day. Ask yourself simple questions. Is it making higher highs? Is price above the moving average? Where is support? Where is resistance? Do this daily. You will improve fast.
5. Where can I read stock market trends for free?
TradingView. Yahoo Finance. NSE India. Investing.com. All free. They have basic charts and tools. You do not need paid software as a beginner.
6. What is the difference between uptrend and downtrend?
Uptrend means higher highs and higher lows. Downtrend means lower highs and lower lows. Trade with the trend. Not against it.
7. What is volume and why does it matter?
Volume is how many shares traded. High volume confirms a move. Low volume means the move is weak. Always check volume before you trade.
8. How long does it take to learn chart reading?
A few weeks for basics months for mastery. Start simple add tools slowly practice every day.