
How to Use Fibonacci Retracement: Levels, Strategy, Groww and Zerodha
Fibonacci retracement is one of those tools that looks complicated but is actually simple. It does not predict the future. It just shows you where price might pause or reverse. Traders use it to find entry points, set stop-losses, and spot potential support and resistance.
This guide explains how to use Fibonacci retracement in simple words. You will learn the key levels, a basic strategy, and how to apply it on platforms like Groww and Zerodha.
What Is Fibonacci Retracement?
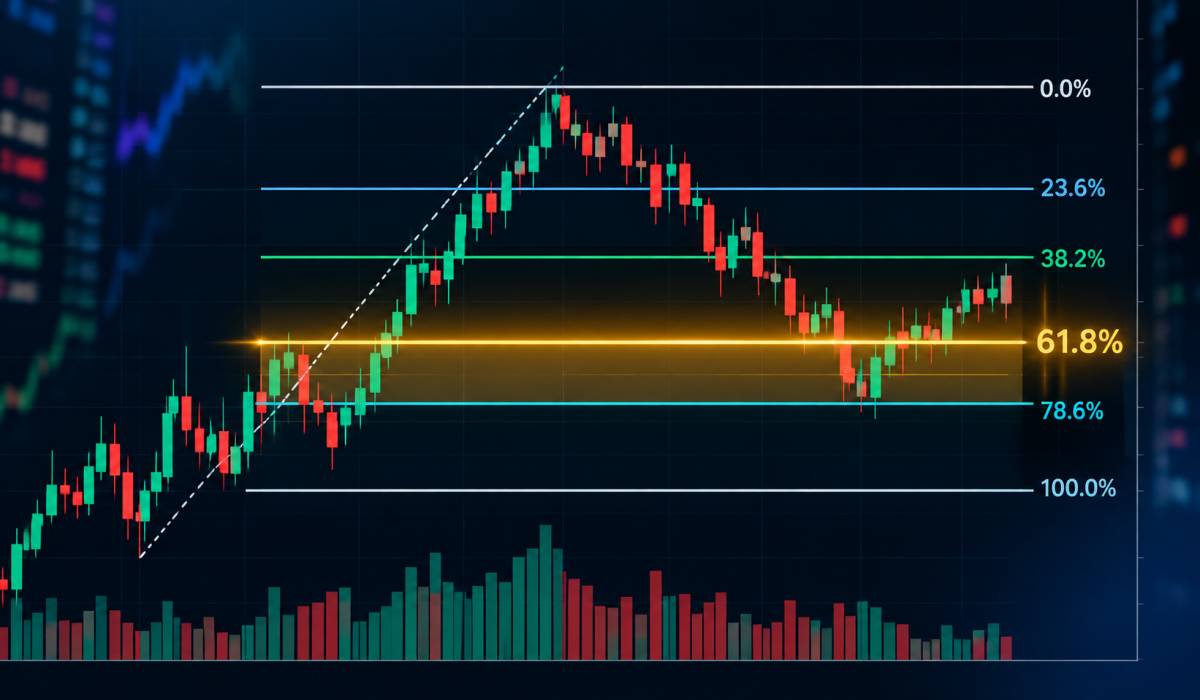
Fibonacci retracement is a technical analysis tool. It draws horizontal lines on your chart at specific percentages. These percentages come from the Fibonacci sequence, a series of numbers where each number is the sum of the two before it. The key ratios are 23.6%, 38.2%, 50%, 61.8%, and 78.6% .
The idea is simple. After a big price move, markets often pull back a little before continuing the trend. Fibonacci levels mark the areas where this pullback might stop. Traders watch these levels because many other traders are watching them too. The 61.8% level is called the "golden ratio" and is considered the most important .
Read More: Stock Investing Strategies for Small Investors: How to Start with Little Money
How to Draw Fibonacci Retracement?
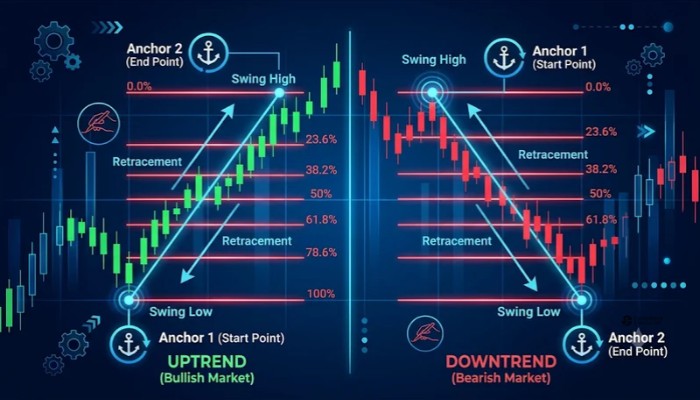
Drawing it correctly is the most important step. If you anchor it wrong, the levels are useless.
- In an uptrend: Find the most recent major swing low. Then find the swing high that followed. Click the low first, then drag to the high. The tool will draw the levels between these two points .
- In a downtrend: Do the opposite. Click the swing high first, then drag down to the swing low. The levels will show where a bounce might stall before the price falls again .
The key is to use major swings, not small wiggles. A major swing has clear one-way movement with several candles. If you are unsure which swing to pick, the levels will not be reliable .
Fibonacci Retracement Levels
Here is what each level means for a pullback in an uptrend.
- 23.6%: A very shallow pullback. The trend is very strong. Price barely dips before resuming. It is often too shallow to trade .
- 38.2%: A normal, healthy pullback. This is a common entry zone for traders looking to join the trend .
- 50%: A medium pullback. This is not an official Fibonacci ratio, but traders watch it because it is the halfway point. It often acts as support or resistance .
- 61.8%: The golden ratio. This is the most watched level. If price holds here, it is a strong sign the trend will continue. If it breaks, the trend may be failing .
- 78.6%: A very deep pullback. The trend is weak. Many traders avoid entering here because the risk of a reversal is high. It is often used as the invalidation level for a trade .
Fibonacci Retracement Strategy
You should never trade on a Fibonacci level alone. It is a zone to watch, not a signal to act. The best setups happen when a Fibonacci level lines up with something else. This is called confluence .
Confluence ideas:
- A Fibonacci level that matches a previous support or resistance level
- A Fibonacci level that aligns with a moving average (like the 50-day or 200-day)
- A Fibonacci level where a candlestick pattern appears (like a hammer or bullish engulfing)
- A Fibonacci level where an oscillator like RSI shows oversold conditions
A simple strategy:
- Identify an uptrend on the daily chart.
- Draw Fibonacci from the swing low to the swing high.
- Wait for price to pull back to the 38.2% or 61.8% level.
- Look for a bullish candlestick pattern at that level.
- Enter the trade.
- Place your stop-loss below the 78.6% level.
- Target the previous high or a Fibonacci extension level .
If price breaks below the 78.6% level, the swing you drew is invalid. Accept the small loss and move on.
How to Use Fibonacci Retracement in Groww?
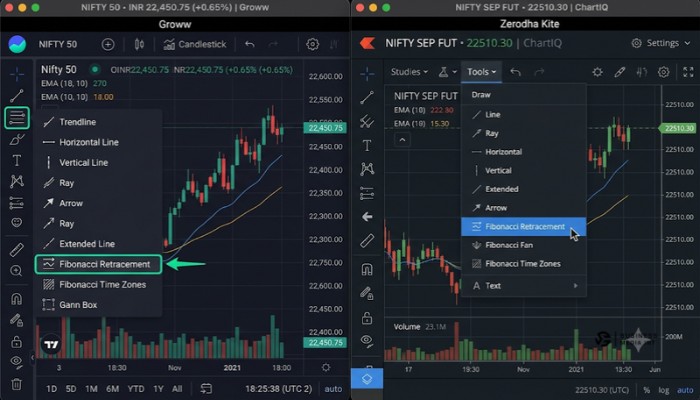
Groww uses charting tools that include Fibonacci retracement. The process is similar to other platforms. Open the chart for the stock you want to analyze. Look for the drawing tools icon, usually a pencil or shapes icon. Find "Fibonacci Retracement" in the menu.
Click your starting point (swing low for uptrend, swing high for downtrend) and drag to the ending point. The levels will appear automatically. You can adjust them if needed.
You May Also Read: What Is Market Capitalization in Stocks? Formula, Examples and Types
How to Use Fibonacci Retracement in Zerodha?
Zerodha's Kite platform has Fibonacci retracement built in, on both the ChartIQ and TradingView engines .
On Kite web:
- Open the chart for your stock.
- Click the drawing tools icon (pencil/shapes).
- Select "Fibonacci Retracement."
- Click the swing low and drag to the swing high (or reverse for a downtrend).
- The levels appear. You can right-click to edit visibility and colors .
On Kite mobile:
- Open the chart.
- Tap the drawing icon in the top bar.
- Tap "Select Tool" and choose Fibonacci Retracement.
- Tap the first point and then the second point .
Common Mistakes to Avoid
- Using minor swings. If you draw from every small dip, the levels shift constantly. Use major, obvious swing points .
- Trading without confirmation. A Fibonacci level is just a line. Wait for a candle, an indicator, or a volume signal before entering .
- Ignoring the higher timeframe. A Fibonacci level on a 5-minute chart is noise. Check the daily or hourly chart to see if the bigger trend agrees .
- Setting stops too tight. Your stop should go beyond the 78.6% level. If you put it right at 61.8%, normal volatility will stop you out .
Quick Summary Table
| Level | Meaning | Action |
|---|---|---|
| 23.6% | Very shallow pullback | Usually too shallow to trade |
| 38.2% | Normal pullback | Common entry zone |
| 50% | Medium pullback | Watch for support/resistance |
| 61.8% | Golden ratio | Most important level. High-probability entry if it holds |
| 78.6% | Deep pullback | Invalidation level. Stop-loss goes beyond this |
FAQs
1. What is Fibonacci retracement in simple words?
It is a tool that draws lines on your chart at key percentages (23.6%, 38.2%, 50%, 61.8%, 78.6%). These lines show where a pullback might stop before the trend continues.
2. How do I draw Fibonacci retracement correctly?
In an uptrend, click the swing low and drag to the swing high. In a downtrend, click the swing high and drag to the swing low. Use major swings, not small wiggles.
3. What is the most important Fibonacci level?
61.8% is the most watched level. It is called the golden ratio. If price holds there, the trend is likely to continue. If it breaks, the trend may be failing.
4. Can I use Fibonacci retracement on Zerodha?
Yes. Kite has it built in. On web, click the drawing tools icon and select Fibonacci Retracement. On mobile, tap the drawing icon, select the tool, and tap your two points.
5. Can I use Fibonacci retracement on Groww?
Yes. Groww's charting tools include Fibonacci retracement. Open a chart, find the drawing tools, select the tool, and drag between your two swing points.
6. Should I trade based only on Fibonacci levels?
No. Fibonacci levels are zones to watch, not signals. Wait for confirmation from a candlestick pattern, an indicator, or a support/resistance level before entering.
7. What does it mean if price breaks the 78.6% level?
It means the swing you drew is invalid. The trend may be reversing. If you are in a trade, your stop-loss should be beyond 78.6% to protect you.
8. What timeframe is best for Fibonacci retracement?
15-minute or higher. Daily charts are best for swing trading. 1-minute and 5-minute charts are too noisy for reliable Fibonacci analysis.