
How to Use Moving Averages for Trading in Indian Market – A Simple Guide
If you trade in Indian market, you know one thing. Price moves up and down very fast. Many people buy at wrong time and lose money. That is why we need a simple tool. That tool is called moving average.
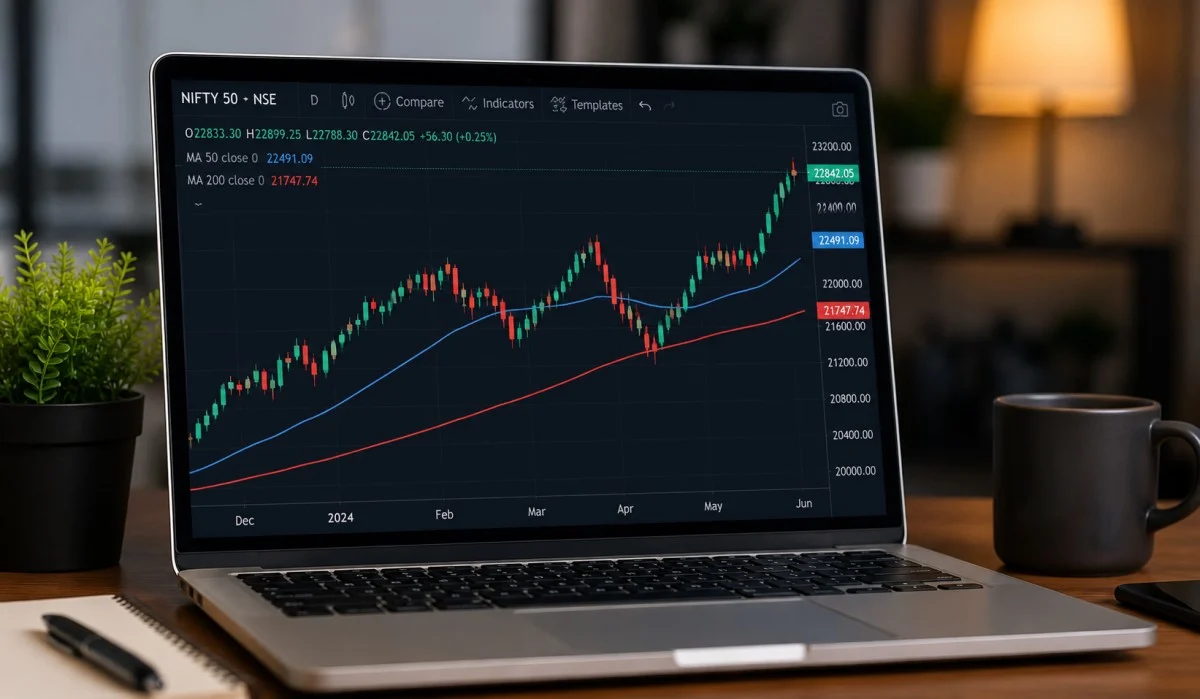
Moving average helps you see the real direction of price. It removes the small ups and downs. In Indian market, Nifty and Bank Nifty move a lot. So moving average works very well here.
In this article, I will show you how to use moving averages for trading in Indian market. You will also learn best moving average crossover for 5 min chart, best moving average for intraday trading, and how to use EMA in trading.
What is Moving Average in Simple Words?
Moving average is a line on your chart. This line shows average price of last few candles.
For example, if you take 20 moving average, the line shows average closing price of last 20 candles. When price is above this line, market is going up. When price is below this line, market is going down.
There are two main types.
Simple moving average (SMA) – Gives equal weight to all prices.
Exponential moving average (EMA) – Gives more weight to recent prices. So EMA reacts faster.
For Indian market, most intraday traders like EMA. Because Indian market moves fast, especially in first hour.
Read More: What is F&O Trading in Nifty and Bank Nifty | Simple Guide

Best Moving Average for Intraday Trading
After trading for many years, I can tell you clearly. For intraday, use EMA 9 and EMA 20 together.
Here is why.
- EMA 9 is fast. It catches small moves.
- EMA 20 is slow. It shows the bigger trend.
When you put both on your 5 minute chart, you see crossovers. That is the best moving average crossover for 5 min chart. Also for very short trades, some people use EMA 5 and EMA 13. But for most Indian intraday traders, EMA 9 and EMA 20 is the best moving average for intraday trading. It gives fewer fake signals.
Best Moving Average Crossover for 5 Min Chart
Now let me explain the best moving average crossover for 5 min chart. This is very useful for Nifty and Bank Nifty futures. Take a 5 minute chart of any Indian stock or index. Add two lines.
- EMA 9 (fast line)
- EMA 20 (slow line)
Buy rule (long trade)
When EMA 9 line crosses above EMA 20 line from below, take buy. That is called golden crossover.
Sell rule (short trade)
When EMA 9 line crosses below EMA 20 line from above, take sell. That is called death crossover.
But do not take every crossover. In Indian market, many crossovers happen inside a range. So only take trades when crossover happens near a support or resistance level. Also check volume. If volume is low, skip the trade.
I have tested this best moving average crossover for 5 min chart on Nifty. It gives good results between 9:30 AM to 11:30 AM and 2:00 PM to 3:15 PM. Avoid first 5 minutes and last 10 minutes.
How to Use EMA in Trading – Step by Step
Many new traders do not know how to use EMA in trading properly. They just add one line and hope. That does not work. So let me teach you three simple ways.
1. Using EMA as trend direction
Put one EMA 50 on daily chart. If price is above EMA 50, only buy. If price is below EMA 50, only sell. This simple rule keeps you with the big trend.
2. Using two EMAs for crossover
We already saw this. EMA 9 and EMA 20 on 5 minute chart. When they cross, take trade. But do not take every crossover. Take only those crossovers that happen after a pullback to EMA 20.
3. Using EMA as support and resistance
In strong uptrend, price comes down to EMA 9 or EMA 20 and goes up again. That is your buying chance. Put stop loss just below that EMA. In downtrend, price goes up to EMA and falls again. That is selling chance.
This is the correct way how to use EMA in trading. No confusion. No overthinking.

How to Use Moving Averages for Trading in Indian Market – Practical Examples
Let me give real examples from Indian market. This will help you understand how to use this for trading in Indian market.
Example 1 – Nifty 5 minute chart
Suppose Nifty is going up. Both EMA 9 and EMA 20 are sloping upward. Price takes a small dip and touches EMA 20. But it does not close below EMA 20. Then price goes up again. This is a good buy. Stop loss is below EMA 20.
Example 2 – Bank Nifty
Bank Nifty moves very fast. So use only EMA 9 and EMA 20. If crossover happens at 10:15 AM, take trade. If crossover happens near 11:45 AM, do not take because market becomes slow. Indian market slows down from 11:45 AM to 1:00 PM usually.
Example 3 – Stock like Reliance or HDFC Bank
For large cap stocks, EMA 20 and EMA 50 on 15 minute chart works very well. When EMA 20 crosses above EMA 50, big move comes.
Remember one thing. Do not copy western strategies directly. Indian market has different timings, different volatility, and different crowd behavior. So always test any moving average setup on Nifty or your favorite stock first.
Common Mistakes Indian Traders Make
I see these mistakes every day. Avoid them and you will do better than 90 percent of traders.
Mistake 1 – Using too many lines
Some people put 4 or 5 moving averages. Chart becomes a mess. Stick to 2 lines only.
Mistake 2 – Taking every crossover
Not every crossover works. In sideways market, crossovers happen every few candles. You will lose money. So only trade crossover when price is clearly trending.
Mistake 3 – Ignoring time of day
In Indian market, best time for moving average crossover is first 2 hours and last 1.5 hours. Middle session is slow.
Mistake 4 – No stop loss
Even the best moving average crossover for 5 min chart can fail. Always keep a stop loss. Place it below the last swing low for buy, and above last swing high for sell.
Complete Trading Plan
Now let me give you a full plan. You can start using this tomorrow in Indian market.
Timeframe – 5 minute chart
Indicators – EMA 9 and EMA 20
Market – Nifty futures or Bank Nifty futures or any liquid stock
Buy conditions
- EMA 9 crosses above EMA 20
- Candle closes above both lines
- Volume is higher than last 5 candles average
- Time is between 9:30 AM to 11:30 AM or 2:00 PM to 3:15 PM
Sell conditions
- EMA 9 crosses below EMA 20
- Candle closes below both lines
- Volume is higher than last 5 candles average
- Same time windows as above
Stop loss – For buy, put stop loss 10 points below EMA 20. For sell, put stop loss 10 points above EMA 20.
Target – First target is 1.5 times your stop loss. Second target is 2.5 times.
Maximum trades per day – Only 3 trades. If you lose 2 trades in one day, stop trading.
This plan is simple. And it works in Indian market because it respects our market timing and movement style.
You May Also Read: Trader Talk Concepts for Stock Market | Beginners Guide
How to Test This on Your Own Chart
Before trading real money, always test. Open your trading app. Take any Indian stock like Tata Motors or any index. Go to 5 minute chart. Add EMA 9 and EMA 20. Go back 10 days. Look at every crossover. See how many worked. Then you will get confidence.
Do not believe any guru blindly. Test yourself. That is the real way to learn how to use moving averages for trading in Indian market.
Final Words
Moving averages are not magic. They just show you what is happening. In Indian market, EMA 9 and EMA 20 on 5 minute chart is one of the best moving average crossover for 5 min chart. For intraday, this same setup is the best moving average for intraday trading. And when you learn how to use EMA in trading with crossover and support method, your trades become much better.
Start slow. Trade only one lot. Keep stop loss. And over time, you will see the difference. The Indian market gives many chances every day. But only those who follow a simple plan take those chances. Be one of them.
FAQs
Q1 – Can I use this for option buying in Indian market?
Yes, but only for direction. Do not use crossover for entry in option buying because time decay hurts you. Use moving average to find trend, then buy option when price pulls back to EMA.
Q2 – What is the best moving average for intraday trading in Bank Nifty?
EMA 9 and EMA 20 on 5 minute chart. Bank Nifty moves very fast, so faster lines like EMA 5 and EMA 13 give many fake signals. Stick to 9 and 20.
Q3 – How to use EMA in trading when market is sideways?
Do not use EMA crossovers in sideways market. In sideways, moving averages flatten and cross up and down many times. You will lose money. Wait for price to break left side high or low.
Q4 – Is this best crossover for 5 min chart good for crypto?
This article is for Indian stock market. Crypto moves 24 hours and has different behavior. So do not apply directly. Indian market has fixed timings and lower volatility than crypto.
Q5 – Can a beginner learn how to use moving averages for trading in Indian market easily?
Yes. Start with only EMA 9 and EMA 20 on 5 minute chart. Practice on paper for 2 weeks. Then start with very small quantity. You will learn faster than most people.