

WisdomTree U.S. High Dividend ETF: Nuances Worth Remembering
Today I continue my series of articles on dividend-oriented ETFs with a piece on WisdomTree U.S. High Dividend Fund (DHS). To begin with, I would like to highlight its low expense ratio of 0.38%, low volatility underpinned by a 60-months beta of only 0.88, a substantial standardized yield of 4.6%, and the methodology that factor in a few fundamental scores to separate the wheat from the chaff.
The issue is that despite fundamentals-focused methodology, the fund has still underperformed the S&P 500 in the last 10 years, as its portfolio has some nuances not to be overlooked.
Source: Unsplash
The top line
With assets under management of ~$772.6 million, DHS tracks the WisdomTree U.S. High Dividend Index and has 295 holdings. The WTHYE itself includes stocks with the highest dividend yields from the WisdomTree U.S. Dividend Index. To be included in the WTHYE, a company must have no less than a $200 million market cap and "average daily dollar volumes of at least $200,000 for the prior three months" (page 13).
Eligible stocks are ranked according to their indicated annual dividend yields; those from the top 30% are then included in the WTHYE, and, hence, the DHS portfolio.
Using the dividend weighted methodology, the index is being recalibrated every year "to reflect the proportionate share of the aggregate cash dividends each component company is projected to pay in the coming year" (source).
What I really like about DHS is that the index it tracks is much pickier than, for example, the WTMDI that I discussed earlier, which does not factor in a composite risk score. In the case of the WTHYE, managers not simply rank stocks according to their anticipated annual dividend payouts: instead, the hierarchy of shares in the list is influenced by the CRS that takes into account three parameters: value, quality, and momentum scores. A stock that has a more appealing mix of these three grades will have a higher weight in the index, and vice versa. The approach was discussed in greater depth by Tripp Zimmerman, CFA in the article.
As stated in the rules-based methodology (page 5), the quality factor takes into account such efficiency indicators like Return on Equity, Return on Assets, gross profits over assets, and cash flows over assets. The momentum factor depends on a stock's risk-adjusted total returns over 6 and 12 months. The value factor is estimated using various ratios from the forward earnings yield to EBITDA/EV (page 22). Importantly, both the QF and VF are calculated within industry groups, which secures an apples-to-apples comparison.
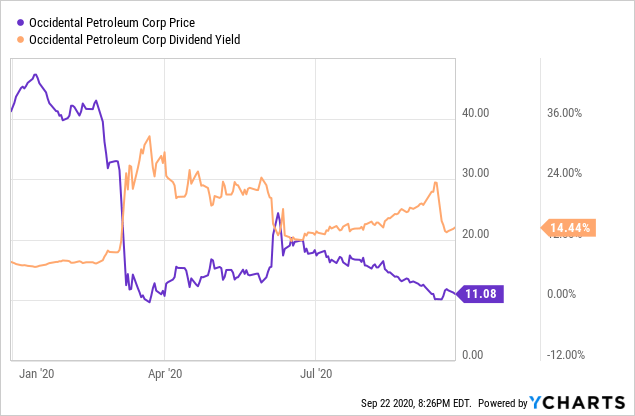
With this composite risk score, WisdomTree attempted to resolve one of the pivotal issues of dividend investing: identification of value traps that investors shun for a reason and that are likely on the cusp of a DPS reduction. The essential problem is that high dividend yield is not indicative of a high-quality business. In many cases, they are antithetical, as appealing yield can point quite to the contrary: a company has fallen out favor with investors, as it is in tatters and its prospects are murky. Its equity value plummeted, and the yield surged as a result. In March this year, we have seen how, for instance, energy players' yields soared as their market values cratered being dragged down by the oil price war. And then a slew of payout reductions followed. For instance, take a look at the case of OXY.
By analyzing the composite risk score, it is possible to identify chronic laggards and mitigate their impact on the overall portfolio performance.
But I would not say that it is perfect; for example, in the methodology, nothing is said about free cash flows which are at the crux of dividend sustainability. If a company uses mostly debt funds to cover the dividend while its organic cash flow is volatile, it can still be included in the index with solid weight, if its CRS is adequate. Besides, debt-adjusted efficiency indicators like Return on Total Capital are also not used.
The portfolio structure. Diversification. An enigma of underperformance despite exposure to market-darling sectors
In order to secure adequate diversification, the index methodology caps both weights of individual stocks and sectors. On page 8, it is clarified that individual security cannot account for more than 5% of the portfolio; in the case when a sector achieves an equal to or over 25% weight, "weight of companies will be proportionally reduced to 25% as of the annual Screening Date." But there is one exception: the real estate sector's weight cannot exceed 5%.
At the moment, the fund's portfolio is dominated by three sectors: healthcare (a 17.04% weight), technology (15.66%), and consumer staples (12.45%), while its footprint in the embattled financial sector is limited, only 8.42%.
At first glance, this winning mix of top-notch ingredients must have bolstered its total returns, especially considering that the coronavirus crisis has created stimuli for these sectors this year.
In reality, despite such a favorable portfolio composition, DHS has failed to outperform the S&P 500 or at least deliver a total return in-line with the U.S. market benchmark in the previous ten years...
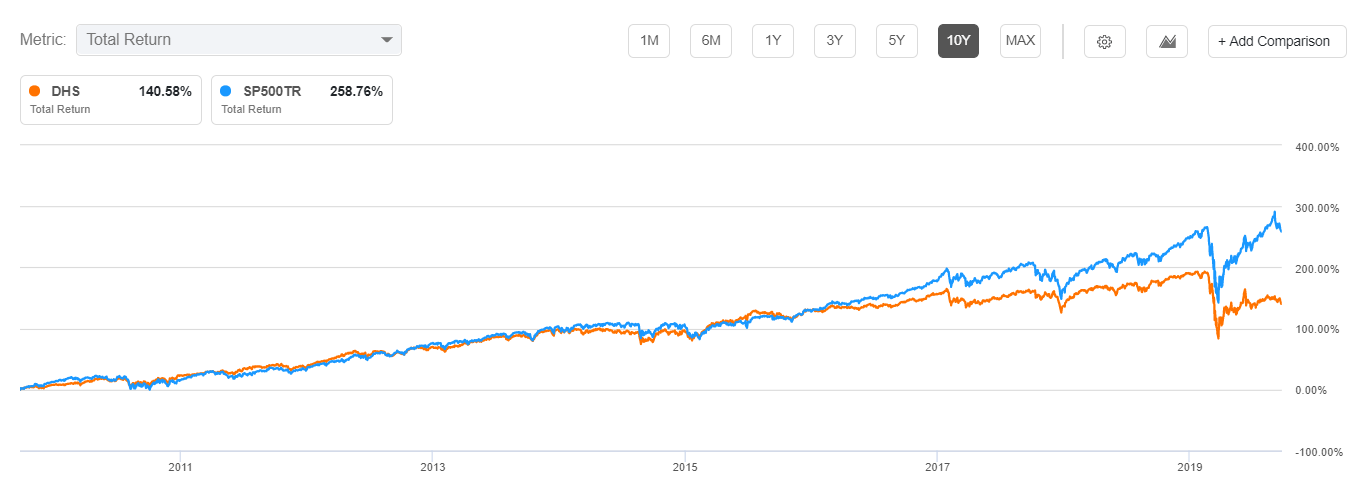
Source: Seeking Alpha
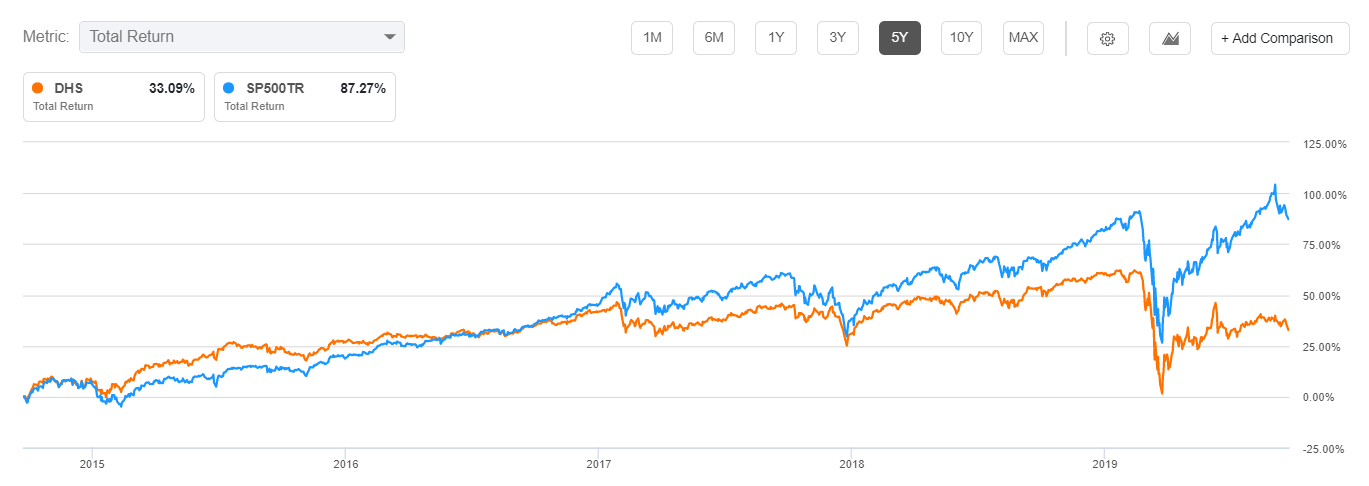 or five years...
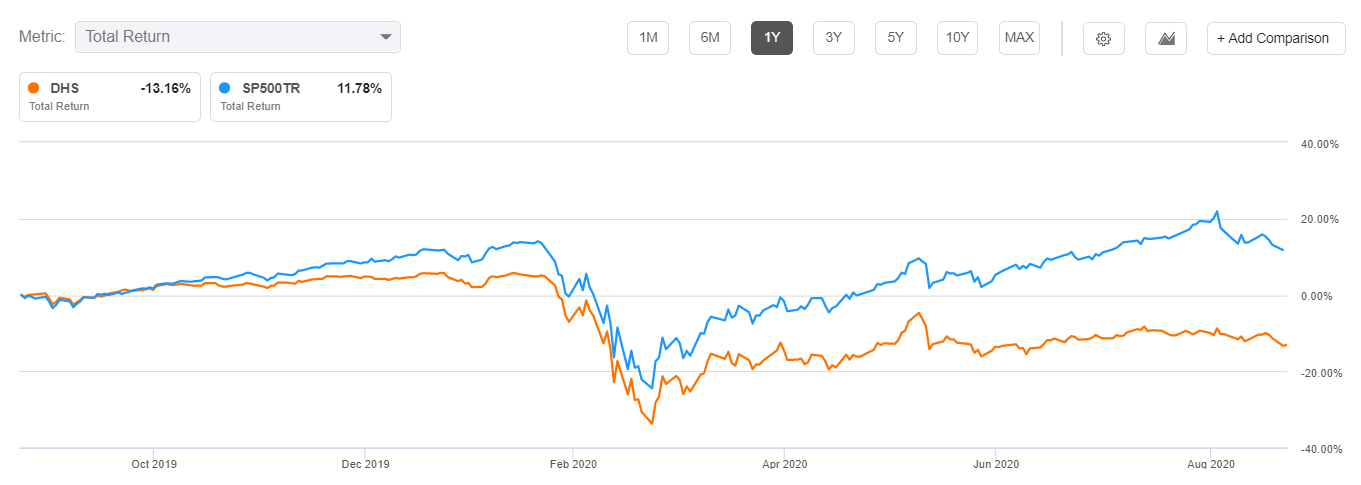 or even this year.
From the 10-year chart, we can see that before 2017, the total returns of the S&P 500 and DHS were relatively tightly correlated, but in the second half of the year, the U.S. market benchmark made a decisive step forward and a meaningful gap emerged. The gap widened materially before the coronavirus sell-off. And when the stocks bottomed in March, it did not evaporate but became even more material. As of September 22, the 10-year total return of DHS was ~140.6% vs. ~258.8% of the S&P 500.
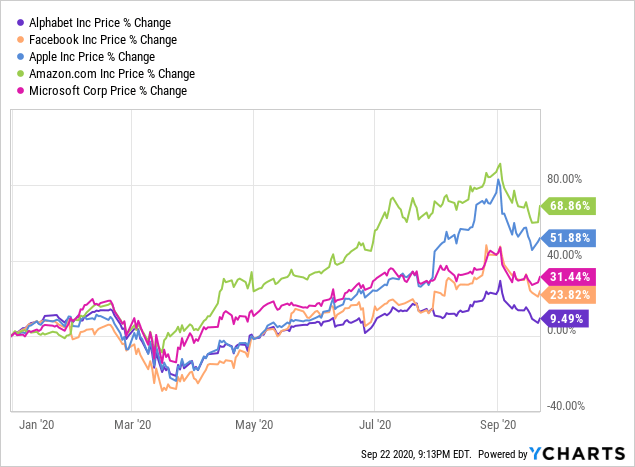
The chart below helps to reveal the culprits of such a perplexing underperformance.
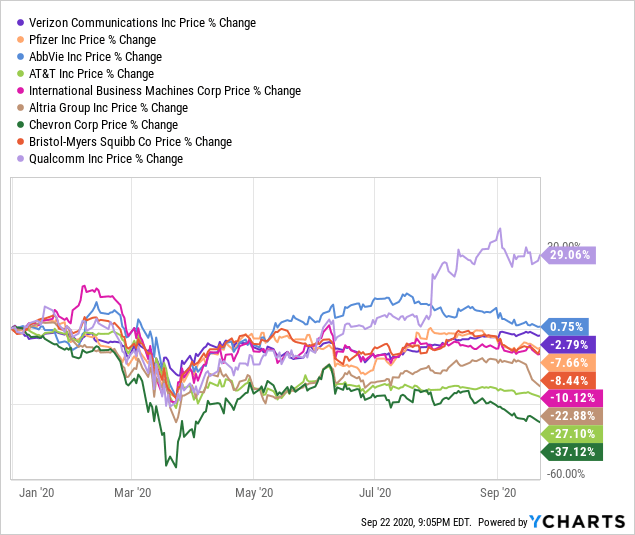
The issue of DHS is that the ten largest holdings account for ~42% of the portfolio. Among these ten heavyweights, only Qualcomm (QCOM) has been a market darling this year, while others are now hovering below their early-January prices, except for AbbVie (ABBV), a biopharmaceutical heavyweight that is attempting to climb back to the July highs.
The most embattled player in the top-ten group is Chevron (CVX), a dividend aristocrat with a ~3.05% weight in the portfolio, which was whipsawed by the oil price war and the coronavirus crisis in spring and has not recovered yet because of weak oil prices.
At the same time, DHS has no exposure to the names that actually propelled the S&P 500 rally (that are still hugely up even despite the recent correction). That is why the fund underperformed the U.S. market benchmark.
Next, analyzing the total holdings dataset, I found out that 87% of companies (256 out of 295 total holdings) in the DHS portfolio have less than half a percent weight. And only 21 stocks have equal to or over 1% weight. So, regarding diversification, DHS is not as good as it seems.
Final thoughts
To sum up, I like that DHS takes into account the composite risk score in order to limit the fund's exposure to stocks with bleak fundamentals and mitigate risks, which makes it a better pick than a ~3.2% yielding DON, which I have discussed recently. However, the CRS could be better if FCF was incorporated.
Certainly, monthly distributions is another obvious advantage of the ETF.
But it is worth understanding that the performance of the fund is predominantly dependent on the ten largest constituents that account for the lion's share of the total holdings.
In sum, I am neutral on DHS.
Disclosure: I/we have no positions in any stocks mentioned, and no plans to initiate any positions within the next 72 hours. I wrote this article myself, and it expresses my own opinions. I am not receiving compensation for it (other than from Seeking Alpha). I have no business relationship with any company whose stock is mentioned in this article.