

InfraCap MLP ETF: Bottom Scooping A Forgotten Very High Yielding ETF
Introduction
Market conditions have been rather abnormal lately with certain industries soaring to new heights whilst others seemingly remain forgotten. A perfect example of the latter is the midstream industry and by extension, the InfraCap MLP ETF (AMZA), which still offers a very high dividend yield of around 18% despite already reducing its dividends repeatedly as this economic crisis weighed on its underlying assets.
Background
The last decade has seen ETFs getting a notable increase in popularity as they became more mainstream by offering investors a simple and fast way to gain exposure whilst maintaining diversification. This saves their often time-poor investors having to dig through seemingly endless amounts of financial statements and investor presentations since they can simply buy the basket of MLPs, as the graph included below displays.
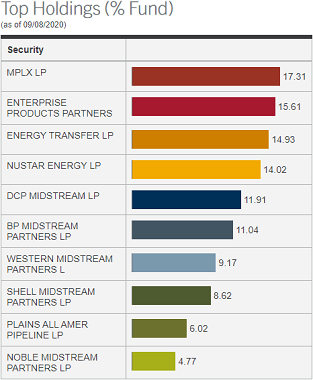
Image Source: Virtus Investment Partners
Similar to all other ETFs its dividends are funded by the distributions that are paid by its underlying MLPs. Following the massive economic disruption from the Covid-19 pandemic, many MLP distributions were reduced and thus were its dividends, as the graph included below displays. Since this downturn has likely passed the worst point, it seems likely that the vast majority of distribution reductions are now in the past, which helps explain its recent move to increase its dividend slightly. Nonetheless to still remain conservative, it would be prudent to assume little to no material growth in the future since the midstream industry is dealing with high leverage.

Image Source: Seeking Alpha
Discounted Cash Flow Valuations
Since it is primarily desired by income investors, its intrinsic values were estimated by using a discounted cash flow valuation that simply replaces its free cash flow with its dividend payments. If interested, all of the details regarding the inputs utilized for these valuations can be found in the subsequent section.
The valuation produced a result of $27.84 per share, which indicates that its intrinsic value is 79.04% higher as of the time of writing. This is very favorable since it means that the intrinsic value for its shares is significantly higher than its current share price, even if its dividends remained depressed forever into the future.
To further illustrate how the odds are stacked favorably in the long-term for investors, a Monte Carlo Simulation has been provided with a wide range of 121 different cost of equity assumptions. It can be seen in the graph included below that a staggering 100% of all intrinsic values were equal to or above its current share price. This is extremely rare and thus an impressive set of results that obviously speak to the sheer value and minimal downside risk that its shares currently offer investors.
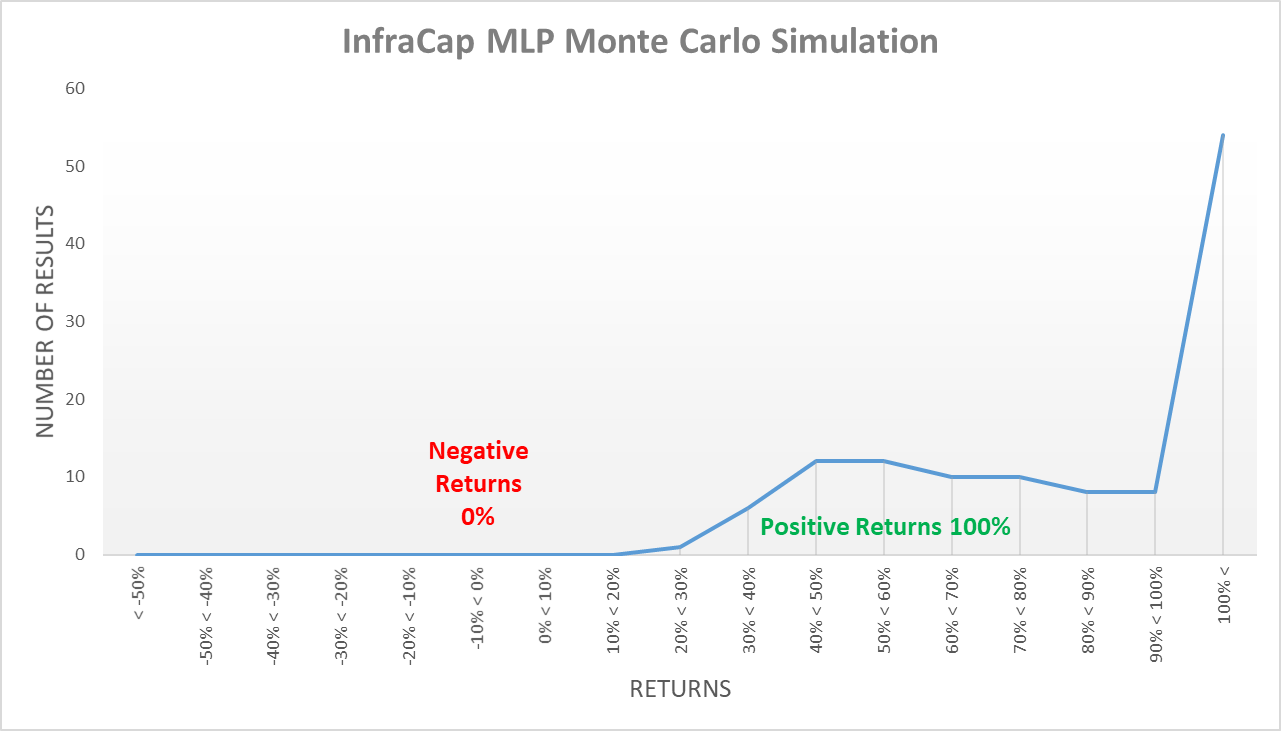
Image Source: Author
Given these extremely strong results whereby no results produced an intrinsic value below their current share price, it thus begs the question to what extent it would have to reduce its dividends to justify its current valuation. To find an answer, the same discounted cash flow valuation was rearranged to simply solve for its dividend instead of intrinsic value, with the table included below containing the results. It can be seen that these vary between 73% and 23% with the average sitting at 48%, which would likely be the worst-case scenario given we are already well into this downturn and this still assumes zero future dividend growth. This means that the market is likely already pricing significant risks and thus new investors should face minimal downside risk.

Image Source: Author
One final consideration to review is the inflation-adjusted payback period for its dividends, as the quicker shareholders see their capital returned, the lesser the probability of losing money in simple non-risk adjusted terms. After reviewing the graph included below it can be seen that it only takes around 6 years for its dividends to repay the initial investment, assuming that inflation averages 2.50% per annum. Needless to explain that this is extremely fast and seldom ever seen, as evidenced by the example scenario that was included to provide context of what to expect from a more standard investment with a 3% dividend yield that grows at 5% per annum perpetually into the future.
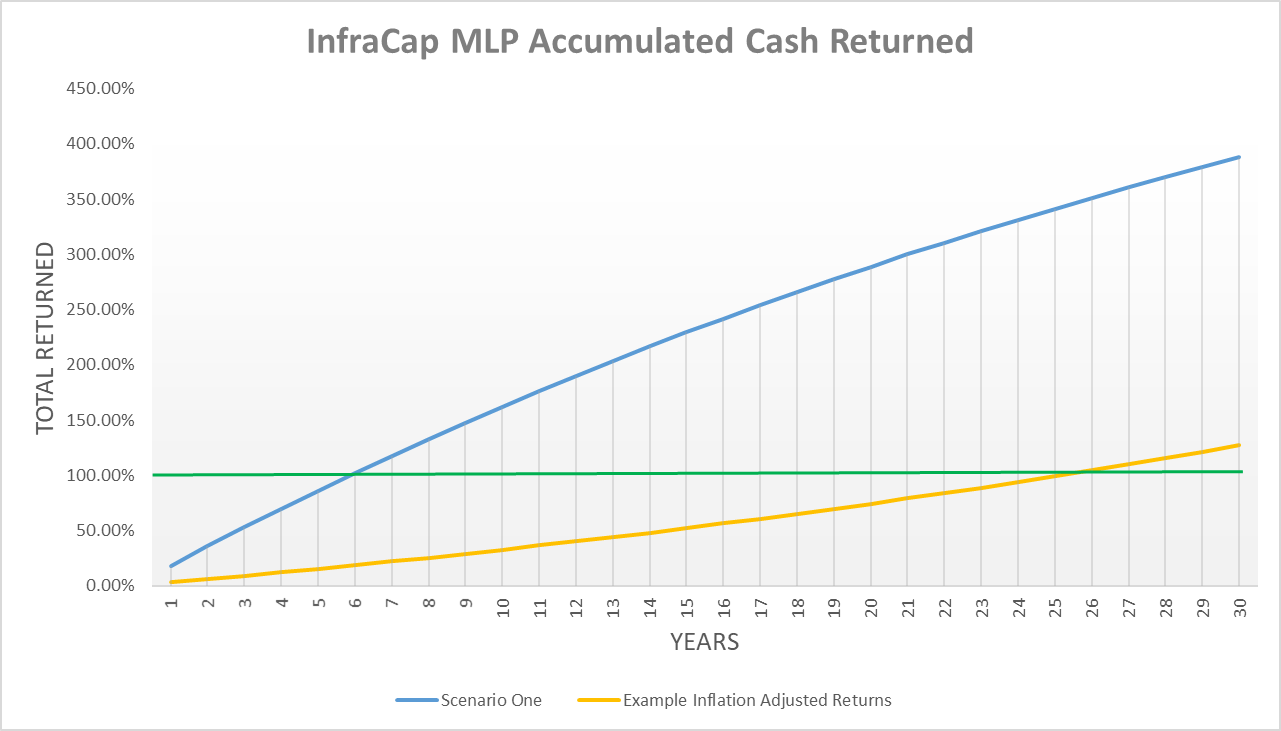
Image Source: Author
Valuation Inputs
The discounted cash flow valuations utilized a cost of equity as determined by the Capital Asset Pricing Model that utilized a 60M Beta of 1.43 (SA), expected market return of 7.50% and risk-free rates as per the United States Treasury Yield Curve on the 08th September 2020, which reflects that risk-free rates are higher in the long-term than the short-term. The Monte Carlo Simulation utilized a wide range of 121 different cost of equity assumptions, which include expected market returns from 5% to 10% and risk-free rates from 0% to 5%, both of which used 0.5% increments.
Conclusion
Whilst it certainly is not the most interesting investment, it does in fact seem significantly undervalued and priced for further material dividend reductions, which no longer appears particularly likely as the worst seems to have past. It offers a highly desirable combination of a very high dividend yield, minimal downside potential with diversification and thus I believe that a very bullish rating is appropriate.
Disclosure: I/we have no positions in any stocks mentioned, and no plans to initiate any positions within the next 72 hours. I wrote this article myself, and it expresses my own opinions. I am not receiving compensation for it (other than from Seeking Alpha). I have no business relationship with any company whose stock is mentioned in this article.