
XVZ: It's Time To Take Profits In This Volatility ETN
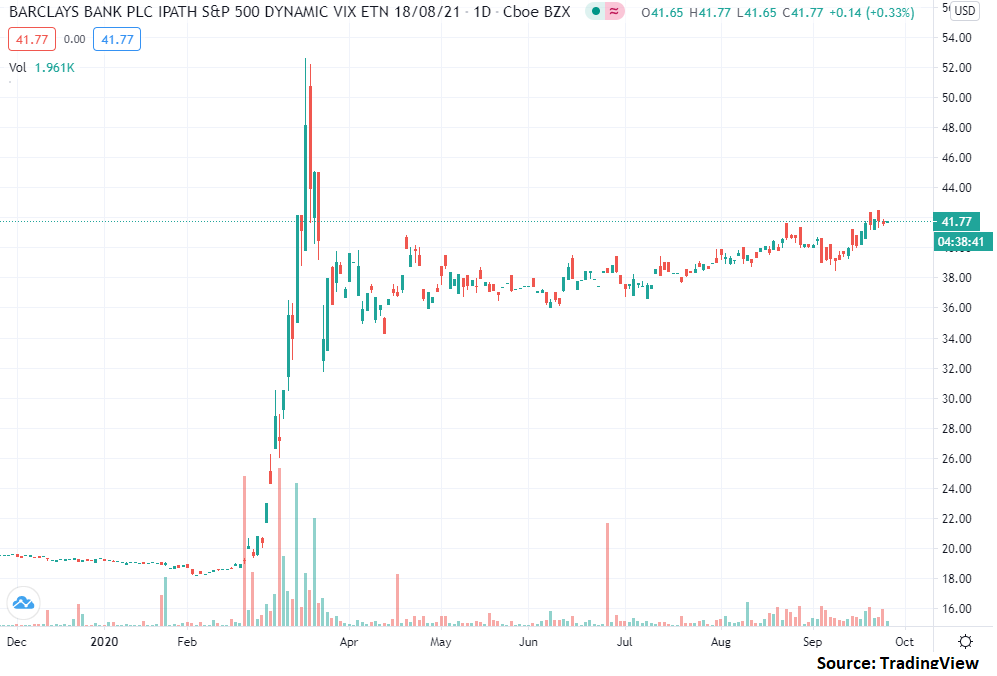
As you can see in the following chart, the iPath S&P 500 Dynamic VIX ETN (XVZ) has somewhat surprisingly held its ground in the wake of the melt-up seen in the VIX earlier this year.
In this article, I argue that while I believe XVZ has an above-average chance of rallying some over the next 1-2 months, the odds still suggest that taking a profit in the ETN at these levels is a good play.
Volatility Markets
To start this piece off, let’s examine the trend which is at work in the S&P 500.
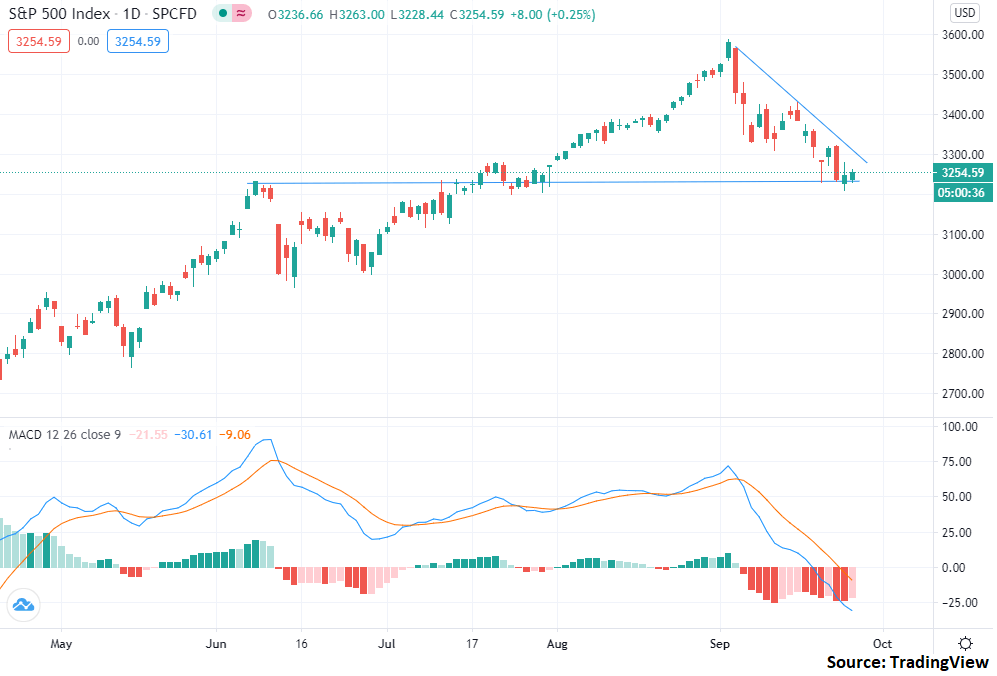
Since the start of September, the market has been falling on the back of higher levels of volatility. This decline in price has seen the S&P 500 drop by about 10% in a move which has erased all of the gains seen in August.
At present, I believe we are reaching a short-term bottom in the trend; however I still view the overall market trend as downwards. In other words, I think there’s a decent chance that we’ll see the S&P 500 higher over the next 1-2 weeks before rolling back over and continuing lower.
The basis for this short-term view is that the current downwards momentum has extended for about a month straight and historically speaking, most recent S&P 500 selloffs have seen the MACD only turn negative for a maximum of around 1 month (as seen in June and also as seen in March which is not shown on the above chart). Additionally, the market is currently testing and holding the key resistance level set in early June and retested in the middle of July.
The reason why it’s important to get a tactical view of the S&P 500 is that there’s a direct correlation between changes in the market and chances in the VIX. If we expect the S&P 500 to rally in the short-term, then we implicitly expect the VIX to fall during that window.
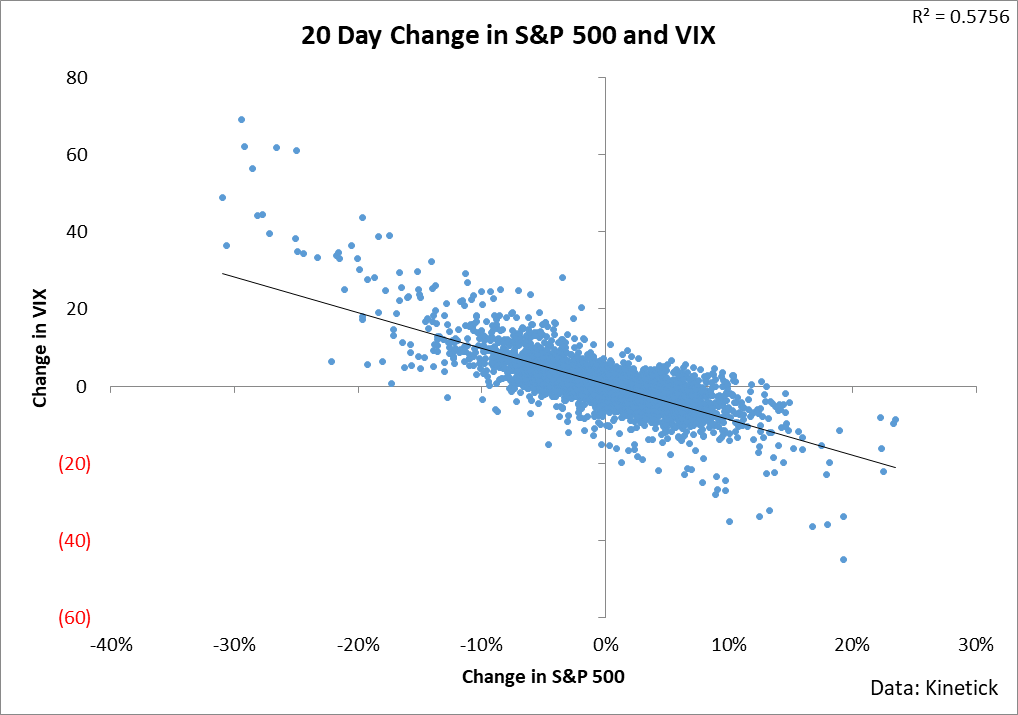
This relationship is interesting in that it really only applies to short-term trading. The longer your holding period of the VIX, the less the correlation you see between changes in the market and changes in the VIX.
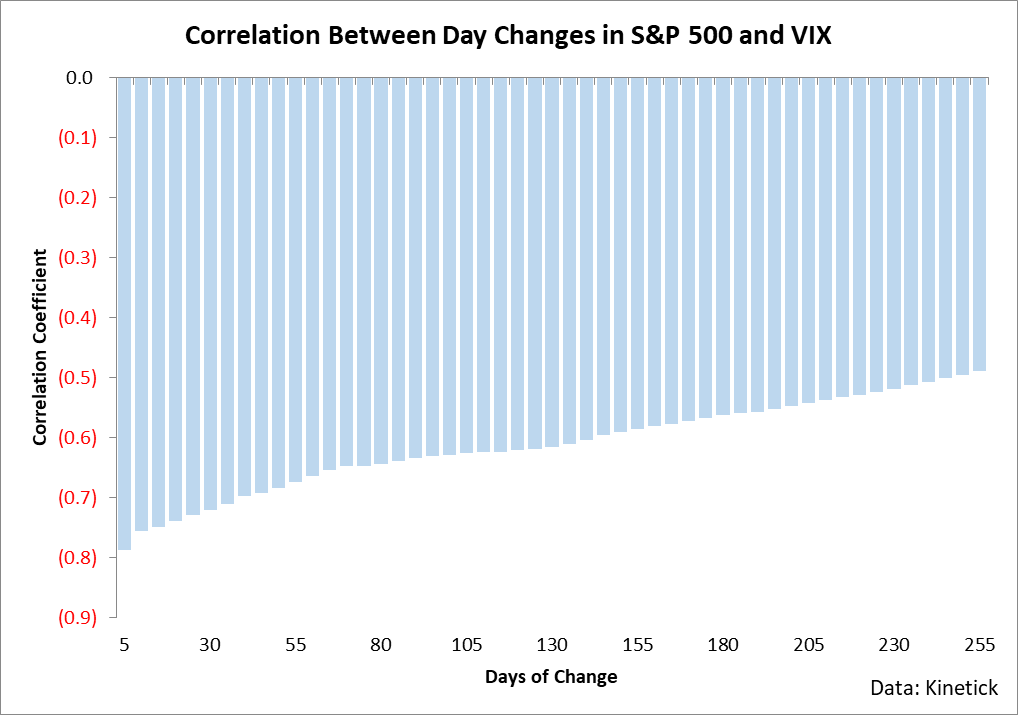
In other words, if you are trading an instrument linked to the VIX in the short-run, then you need to be mindful of likely market directions because where the market goes, the VIX will tend to see the opposite.
This said however, there’s also another relationship which is important to monitor at this point and that is the S&P 500 hitting new monthly lows.
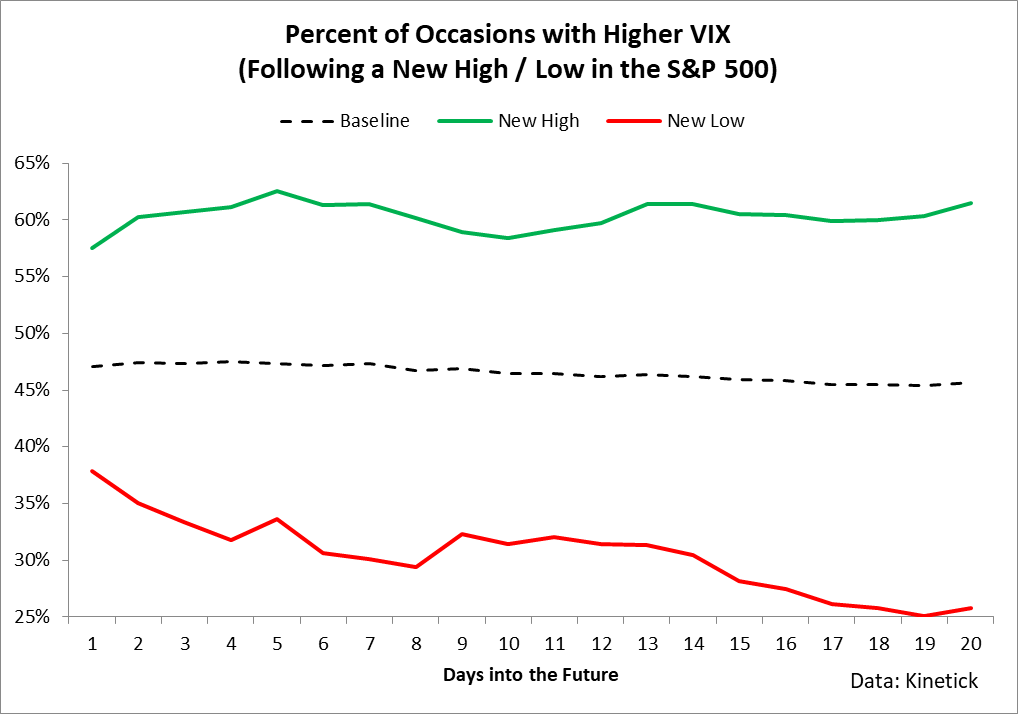
This chart shows what happens to the VIX following the S&P 500 hitting new 1-month highs or lows. It shows a very clear trend in which when the market hits new lows, the VIX actually tends to fall over the next month with historic data saying that there’s about a 30% chance that it’ll be lower 1 month from now.
To put some potential numbers around this contract, I estimate that over the next 1-2 weeks, we could see the S&P 500 retrace around half of its recent downwards move. This would suggest that we could see the market rally by 5% over the next few weeks.
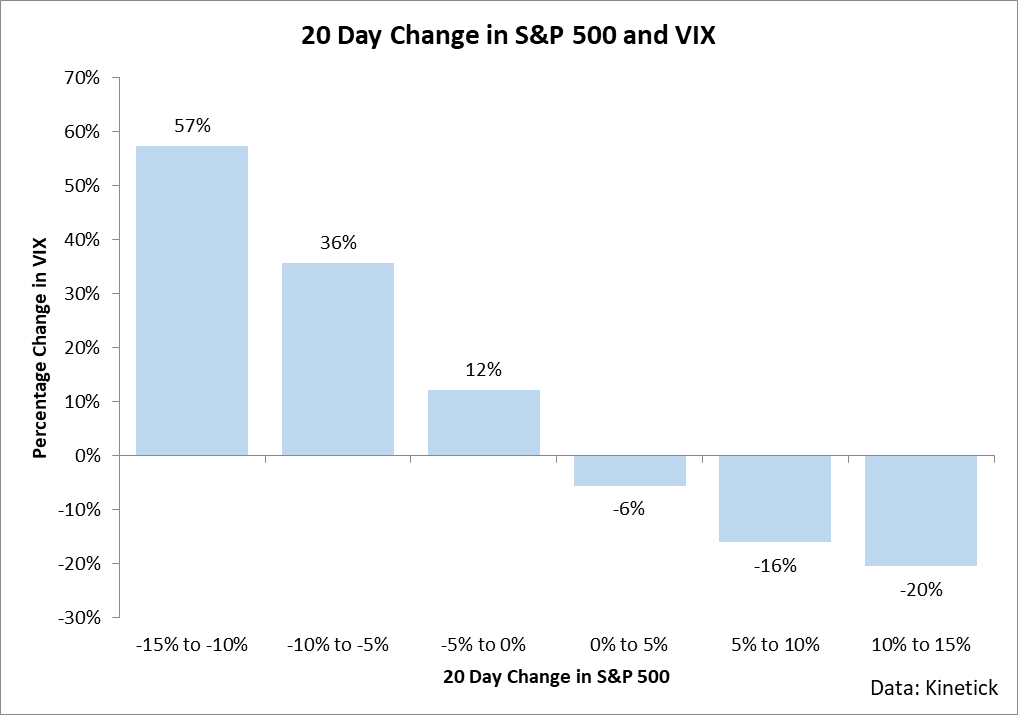
If I am correct in my analysis that the market is extended to the downside and likely to correct by this amount, then historically speaking, we could see the VIX decline by about 16%. There is a lot of uncertainty around this number and the speed and timing of market movements will vary this analysis substantially – however, if we see the market pullback in the short-run, then we’re likely to see the VIX decline.
This said, I still do have a longer-term bullish view on the VIX based on the clear tendencies at work in the data.
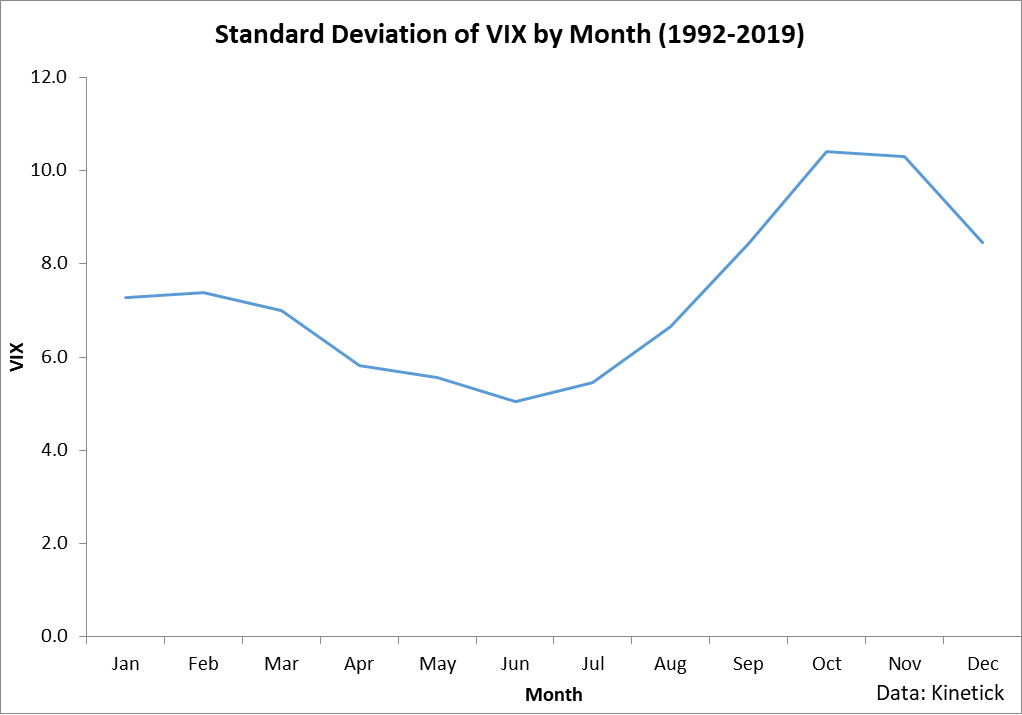
Historically speaking, the VIX is most volatile during late October and through November. In fact, most of the past major VIX-rallies have occurred during this time period which has left a clear seasonal pattern in the data.
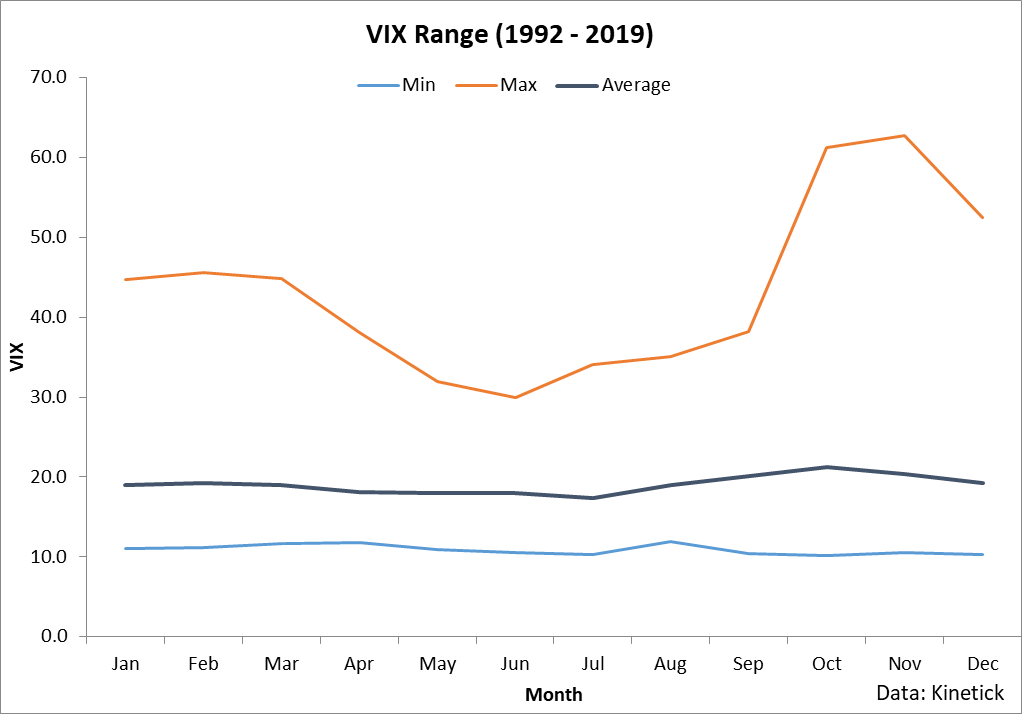
I believe we could see this relationship play out once again, especially considering the uncertainty regarding the election and the general tendency for election years to see some sort of increase in the VIX (even if mild).
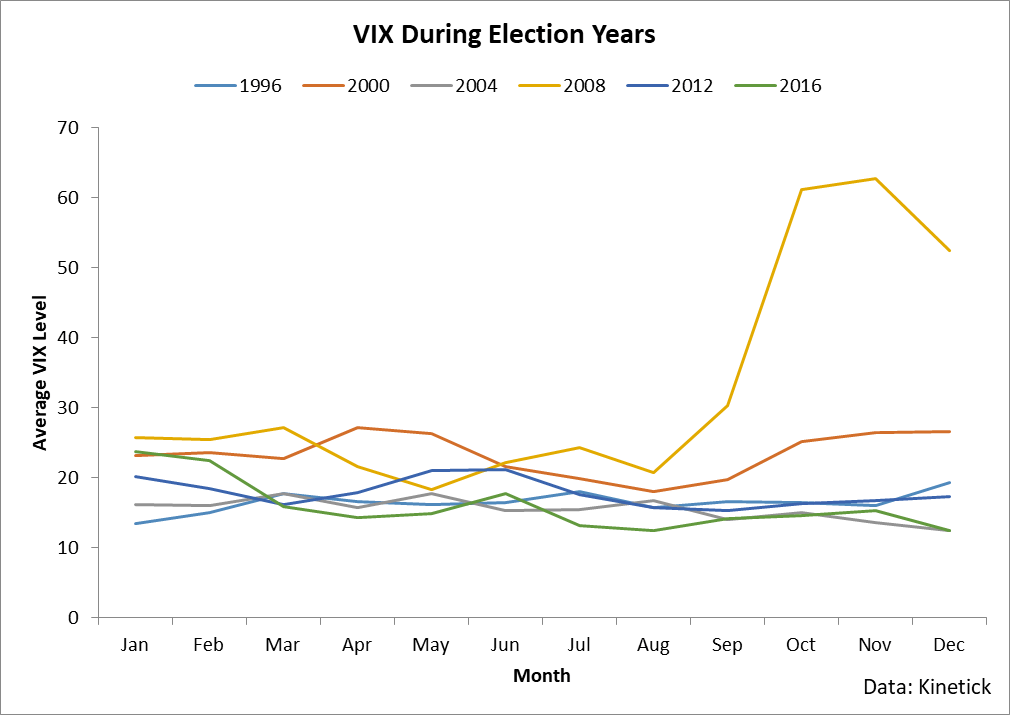
To put all this together, I believe the data supports a short-term selloff in the VIX followed by a medium-term rally around late October and through the election.
About XVZ
While it’s important to maintain a view on the VIX when trading VIX-linked instruments, we must make a very firm differentiation between the performance of XVZ and the actual performance of the VIX. The reason why we must do this is because XVZ is not actually holding the VIX, it is holding VIX futures. And beyond that, it is not only holding VIX futures, but it is dynamically shifting between two different futures tracking methodologies. In other words, XVZ is a complex ETN which requires a substantial degree of nuance and study to understand what is exactly happening beneath the surface.
XVZ’s basic methodology is this: it dynamically shifts between the short-term and mid-term VIX futures indices provided by S&P Global. At times it shifts in such a way as to best reduce roll yield. Here are the long-run performances of these three approaches:
- The short-term futures index holds and rolls exposure in the first two months of the VIX futures curve and it has declined at a pace of 47% per year for the past decade.
- The mid-term futures index holds and rolls exposure in the fourth through seventh month VIX futures contracts and it has declined at a pace of 20% per year for the past decade.
- The dynamic futures index (the one XVZ is tracking) jumps between these two indices and has fallen at a pace of 2% per year for the past decade.
In essence, XVZ is playing hot-potato with two indices which have proven track record of removing wealth from shareholders. It shifts between indices which decline at a pace of anywhere from 20-50% per year and it manages to reduce roll yield in the process.
However, we have to note a few things about this reduced roll yield impact. First off, this 2% decline per year historically seen in XVZ is resting on the back of one of the largest rallies in the history of the VIX. If you were to remove the current rally from the dataset, year after year of losses are the norm for XVZ holders with the last mildly profitably year seen about 9 years ago.
And secondly, when you shift exposure between two indices, you are actually dramatically changing the source of return from your holdings.
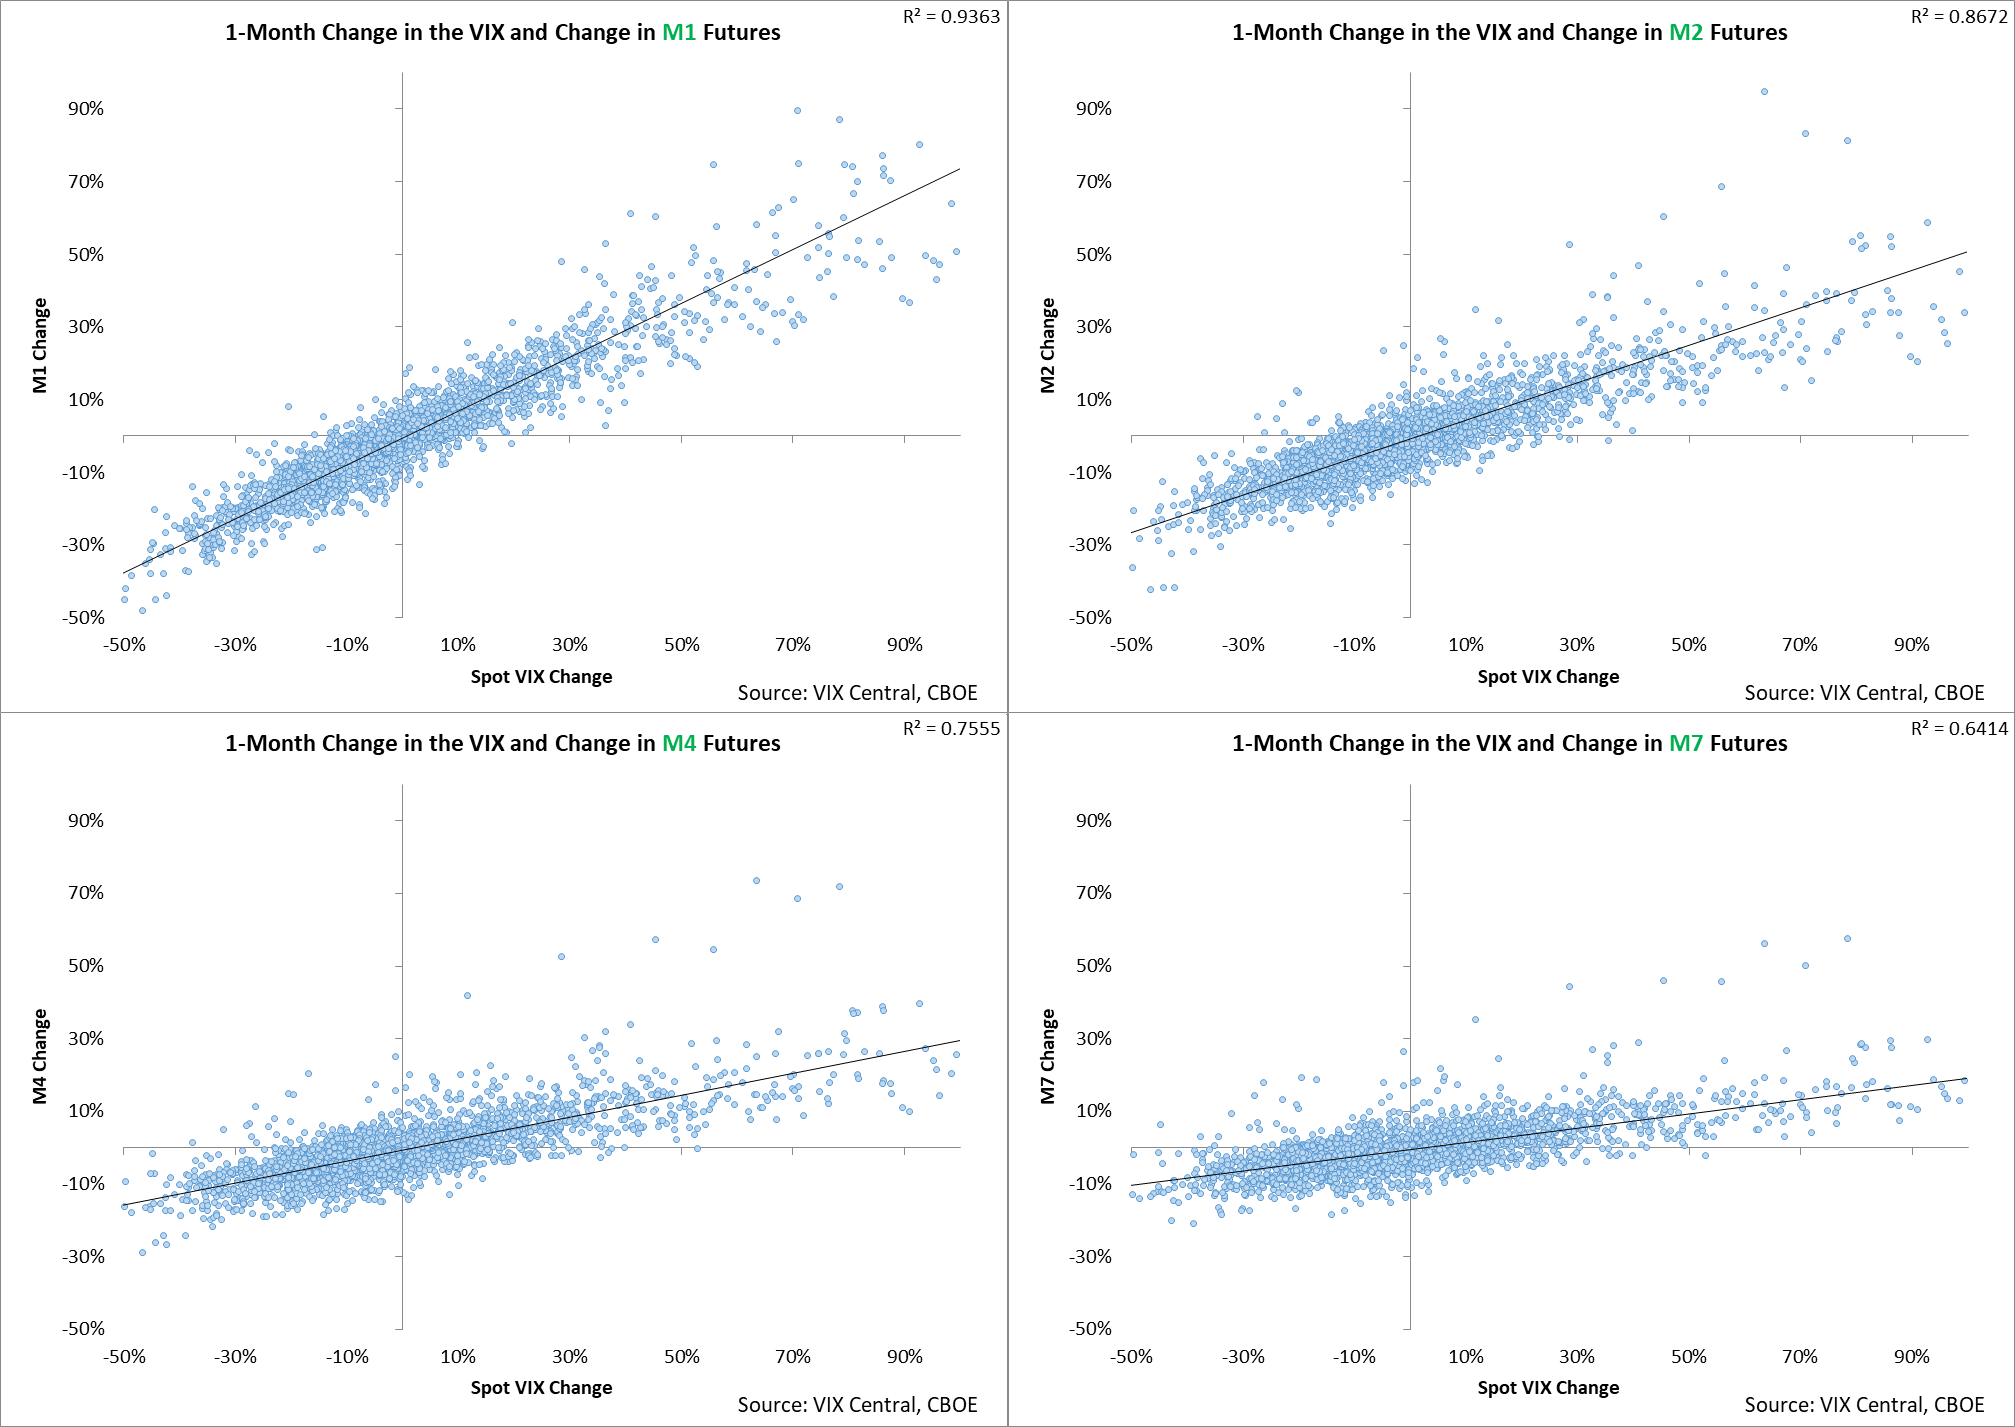
This chart is a bit complicated, but it pays to internalize its message. What this shows is that the correlation between actual changes in the VIX and the changes concurrently witnessed in VIX futures declines by time until expiry. In other words, prompt futures are much more correlated to the VIX than futures 4-7 months out from expiry.
What this means is that when you’re holding XVZ, you can actually see dramatically different drivers in return depending on the structure of the futures curve. When the curve is heavily in contango, XVZ is likely holding the longer-dated futures strategy, but during backwardation it is likely in the shorter-dated futures. This practically means the correlations you see to changes in the VIX are actually going to be variable through time which makes the utility of XVZ difficult to assess.
In the long-run however, I believe the numbers clearly suggest that XVZ declines through time with only the largest of rallies in the VIX resulting in sizable gains for holders of the ETN. This, combined with the variable sources of return in the ETN place this product in the sell category and I do not view it is a good addition to portfolios.
Conclusion
The S&P 500 is likely going to rally over the next 1-2 weeks which should lead to a decline in the VIX. Historic tendencies suggest the VIX could rally in late October and through November. XVZ is changing between two fairly different indices but long-term losses are still the norm for this instrument.
Disclosure: I/we have no positions in any stocks mentioned, and no plans to initiate any positions within the next 72 hours. I wrote this article myself, and it expresses my own opinions. I am not receiving compensation for it (other than from Seeking Alpha). I have no business relationship with any company whose stock is mentioned in this article.