
Weekly Closed-End Fund Roundup: October 4, 2020
Author's note: This article was previously released to CEF/ETF Income Laboratory members. Please check latest data before investing.
The Weekly Closed-End Fund Roundup will be put out at the start of each week to summarize recent price movements in closed-end fund (CEF) sectors in the last week, as well as to highlight recently concluded or upcoming corporate actions on CEFs, such as tender offers. Most of the information has been sourced from CEFInsight or the Closed-End Fund Center. I will also link to some articles from Seeking Alpha that I have found for useful reading over the past week. The searchable tag for this feature is "cildoc". Data is taken from the close of Friday, October 2nd, 2020.
Weekly performance roundup
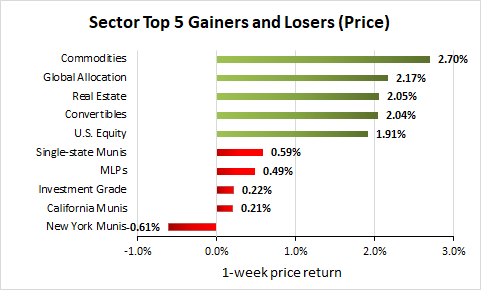
Markets rebound strongly as 22 out of 23 sectors were positive on price (up from 0 last week) and the average price return was +1.25% (up from -3.39% last week). The lead gainer was Commodities (+2.70%), followed by Global Allocation (+2.17%) and Real Estate (+2.05%), while the weakest lowest sector by Price was New York Munis (-0.61%), followed by California Munis (+0.21%) and Investment Grade (+0.22%).
(Source: Stanford Chemist, CEFConnect)
17 out of 23 sectors were positive on NAV (up from 3 last week), while the average NAV return was +1.05% (up from -2.42% last week). The top sectors by NAV were Real Estate (+3.96%), Commodities (+2.86%), and Convertibles (+2.36%). The weakest sectors by NAV were Taxable Munis (-0.71%), New York Munis (-0.32%), and California Munis (-0.28%).
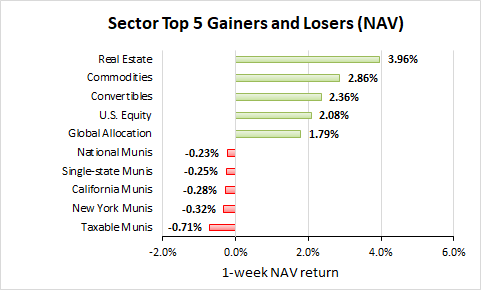
(Source: Stanford Chemist, CEFConnect)
The highest premium sector was Taxable Munis (+3.01%), while the sector with the widest discount was MLPs (-26.27%). The average sector discount is -8.55% (up from -8.83% last week).
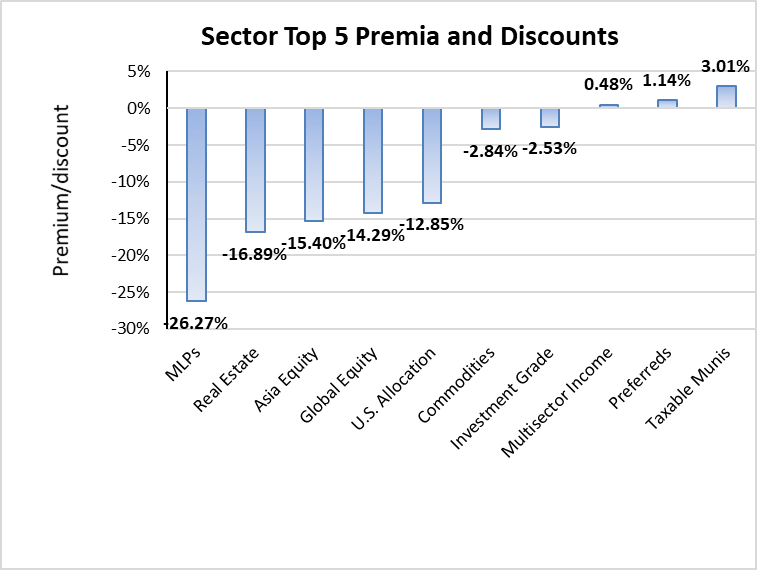
(Source: Stanford Chemist, CEFConnect)
The sector with the highest premium/discount increase was Taxable Munis (+1.51%), while Real Estate (-1.47%) showed the lowest premium/discount decline. The average change in premium/discount was +0.29% (up from -0.92% last week).
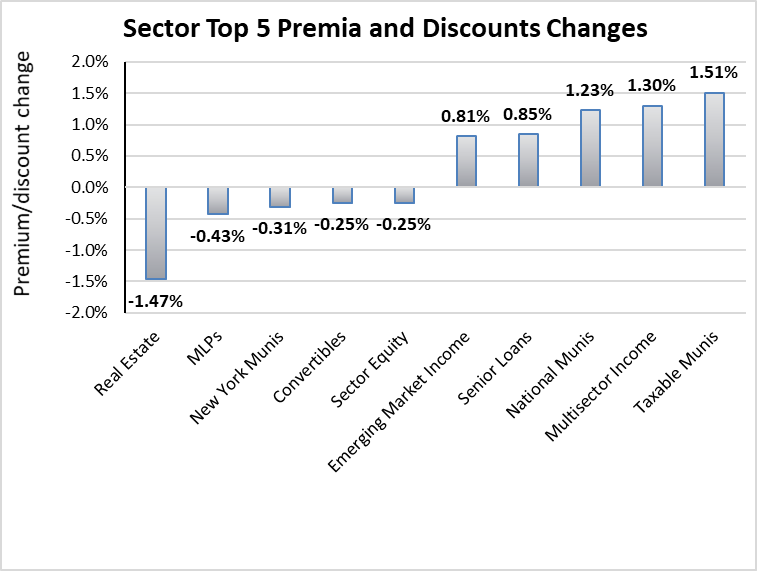
(Source: Stanford Chemist, CEFConnect)
The sector with the highest average 1-year z-score was Taxable Munis (+0.71), followed by Single-state Munis (+0.25). The sector with the lowest average 1-year z-score was MLPs (-1.36), followed by Convertibles (-1.22). The average z-score is -0.45 (up from -0.55 last week).
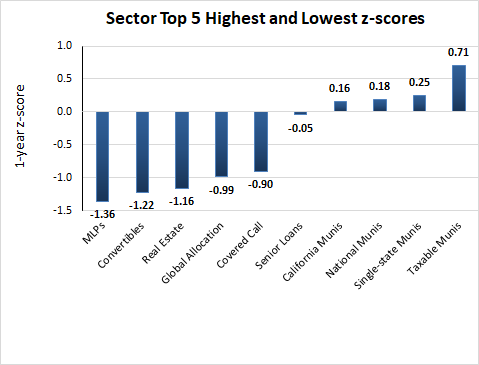
(Source: Stanford Chemist, CEFConnect)
The sectors with the highest yields were MLPs (20.74%), Global Allocation (10.76%), Limited Duration (9.48%), Emerging Market Income (9.24%), and Real Estate (9.16%). Discounts and z-scores for the sectors are included for comparison. The average sector yield is +7.68% (down from +7.76% last week).

(Source: Stanford Chemist, CEFConnect)
Individual CEFs that have undergone a significant decrease in premium/discount value over the past week, coupled optionally with an increasing NAV trend, a negative z-score, and/or are trading at a discount, are potential buy candidates.
Fund | Ticker | P/D decrease | Yield | P/D | Z-Score | Price change | NAV change |
Gabelli Utility Trust | -10.45% | 7.81% | 97.94% | 1.6 | -0.13% | 5.15% | |
Gabelli Multimedia | -5.82% | 13.71% | -3.17% | -1.8 | -2.28% | 3.59% | |
OFS Credit Company Inc | -5.11% | 23.45% | -21.86% | -0.7 | -6.15% | 0.00% | |
Gabelli Equity | -5.00% | 11.86% | 0.80% | -1.2 | -0.78% | 4.15% | |
Cohen & Steers Total Return | -4.21% | 7.85% | -4.38% | -1.3 | 0.41% | 4.84% | |
Principal Real Estate Income Fund | -4.18% | 12.44% | -26.52% | -2.2 | -2.84% | 2.70% | |
Nuveen NY Municipal Value | -4.08% | 3.37% | -0.40% | 0.2 | -4.13% | -0.20% | |
Cohen & Steers Select Preferred & Inc | -3.60% | 7.24% | 2.56% | -1.0 | -2.11% | 1.36% | |
Western Asset Inflation-Linked Income Fd | -3.29% | 2.92% | -12.36% | -0.9 | -3.43% | 0.22% | |
DNP Select Income | -3.09% | 7.70% | 18.02% | -1.1 | -0.78% | 1.82% |
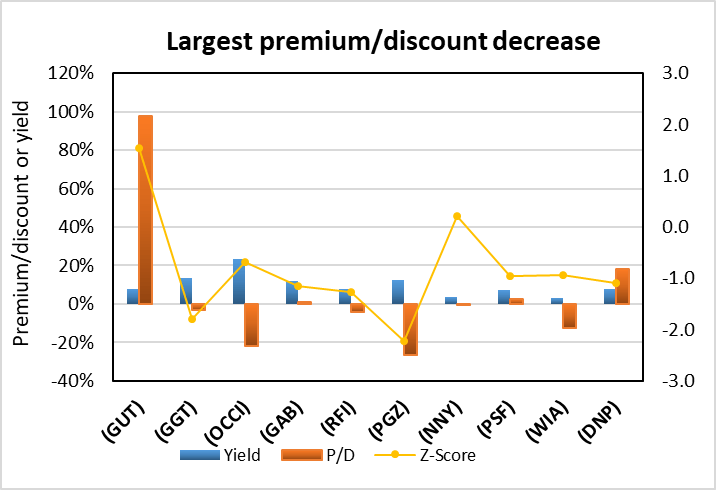
(Source: Stanford Chemist, CEFConnect)
Conversely, individual CEFs that have undergone a significant increase in premium/discount value in the past week, coupled optionally with a decreasing NAV trend, a positive z-score, and/or are trading at a premium, are potential sell candidates.
Fund | Ticker | P/D increase | Yield | P/D | z-score | Price change | NAV change |
Oxford Lane Capital Corp. | 6.91% | 18.12% | 18.88% | -0.6 | 6.18% | 0.00% | |
Special Opportunities | 6.12% | 9.19% | -8.96% | 0.3 | -1.52% | -3.61% | |
Eagle Point Credit Company LLC | 5.98% | 11.19% | 0.47% | 0.7 | 6.32% | 0.00% | |
PIMCO Municipal Income III | 4.67% | 4.74% | 6.30% | 0.1 | 4.20% | -0.36% | |
FIRST TRUST HY OPPORTUNITIES 2027 Term | FTHY | 4.59% | % | 1.03% | 0.0 | 5.10% | 0.34% |
XAI Octagon FR & Alt Income Term Trust | 4.50% | 11.92% | -4.43% | -0.6 | 5.25% | 0.31% | |
Nuveen Municipal Credit Opps Fund | 4.49% | 5.85% | -2.11% | -0.3 | 4.55% | -0.23% | |
BlackRock Health Sciences Trust II | 4.46% | 5.03% | -7.17% | 0.0 | 6.74% | 1.64% | |
Mexico Fund | 4.46% | 6.98% | -15.36% | 2.8 | 3.51% | -3.27% | |
PIMCO Income Opportunity | 4.24% | 9.78% | 6.10% | -0.6 | 5.00% | 0.83% |
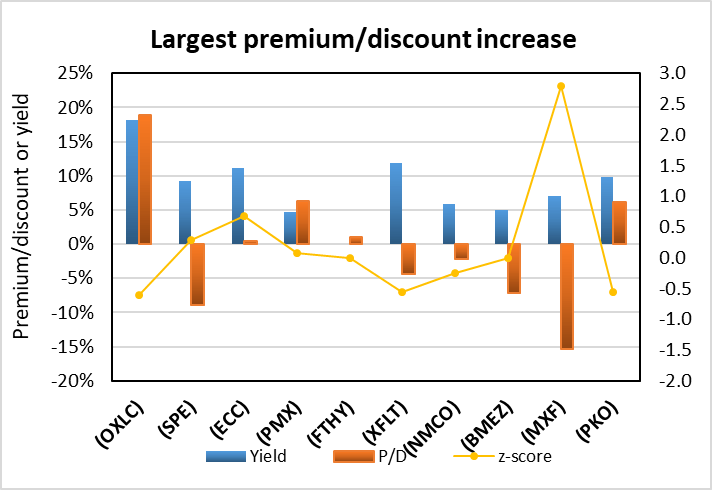
(Source: Stanford Chemist, CEFConnect)
Distribution changes announced this month
These are sorted in ascending order of distribution change percentage. Funds with distribution changes announced this month are included. Any distribution declarations made this week are in bold. I've also added monthly/quarterly information, as well as yield, coverage (after the boost/cut), discount, and 1-year z-score information. I've separated the funds into two sub-categories, cutters and boosters.
Cutters
Name | Ticker | Change | Previous | Current | Yield | Discount | z-score | Coverage | Announced | Ex-date |
Nuveen Municipal 2021 Target Term | -53.8% | 0.013 | 0.006 | 0.74% | -0.81% | 0.5 | 234% | 9/1/2020 | 9/14/2020 | |
Eaton Vance High Income 2021 Target Term | -33.3% | 0.03 | 0.02 | 2.51% | -2.84% | -0.4 | 161% | 9/1/2020 | 9/10/2020 | |
TCW Strategic Income | -28.3% | 0.0906 | 0.065 | 4.68% | -0.80% | -0.1 | 39% | 9/16/2020 | 9/29/2020 | |
Nuveen Corporate Income November 2021 | -22.2% | 0.0315 | 0.0245 | 3.27% | -4.57% | -1.3 | 25% | 9/1/2020 | 9/14/2020 | |
Nuveen Emrg Mkts Debt 2022 Target Term | -10.7% | 0.0375 | 0.0335 | 5.19% | 0.92% | 0.8 | 123% | 9/1/2020 | 9/14/2020 | |
JHancock Income Secs | -9.3% | 0.205 | 0.1859 | 4.83% | -3.45% | 1.4 | 25% | 9/1/2020 | 9/10/2020 | |
JHancock Investors | -8.5% | 0.3778 | 0.3455 | 8.71% | -7.14% | 0.0 | 29% | 9/1/2020 | 9/10/2020 | |
Tri-Continental | -7.2% | 0.2824 | 0.2622 | 4.02% | -12.89% | -0.6 | 34% | 9/1/2020 | 9/15/2020 | |
Templeton Global Income | -4.6% | 0.0152 | 0.0145 | 3.26% | -13.33% | -0.4 | 137% | 9/1/2020 | 9/14/2020 | |
Royce Value Trust | -3.8% | 0.26 | 0.25 | 7.75% | -14.85% | -1.4 | 6% | 9/1/2020 | 9/10/2020 | |
Voya Prime Rate Trust | -3.4% | 0.0145 | 0.014 | 3.80% | -7.53% | 0.6 | 157% | 9/1/2020 | 9/9/2020 | |
MFS Multimarket Income | -3.3% | 0.04354 | 0.04211 | 8.76% | -7.09% | -0.3 | 57% | 9/1/2020 | 9/15/2020 | |
Sprott Focus Trust | -2.1% | 0.1093 | 0.107 | 7.16% | -15.54% | -1.3 | 11% | 9/2/2020 | 9/14/2020 | |
Wells Fargo Multi-Sec Inc | -0.6% | 0.0939 | 0.09336 | 10.37% | -11.33% | -1.1 | 68% | 9/25/2020 | 10/13/2020 | |
Wells Fargo Util & High Inc | -0.5% | 0.07233 | 0.072 | 7.14% | -0.62% | -1.5 | 45% | 9/25/2020 | 10/13/2020 | |
Wells Fargo Inc Opp | -0.4% | 0.05668 | 0.05648 | 9.11% | -11.74% | -0.5 | 78% | 9/25/2020 | 10/13/2020 | |
MFS® Government Markets Inc | -0.3% | 0.02938 | 0.0293 | 7.55% | -2.71% | 0.8 | 29% | 9/1/2020 | 9/15/2020 | |
MFS® Intermediate Income | -0.1% | 0.02856 | 0.02853 | 9.15% | -6.03% | -0.3 | 28% | 9/1/2020 | 9/15/2020 |

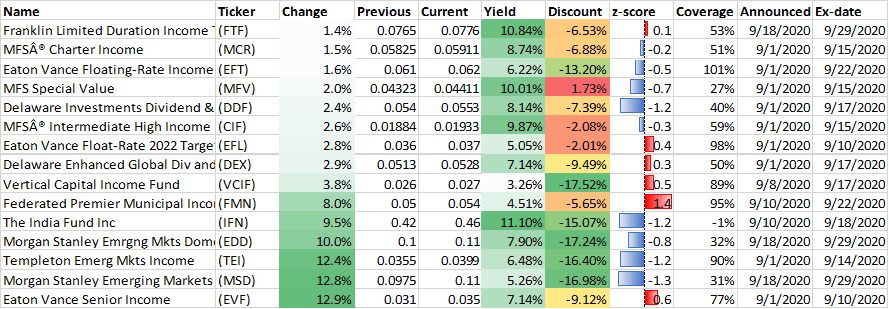
Boosters
Name | Ticker | Change | Previous | Current | Yield | Discount | z-score | Coverage | Announced | Ex-date |
Franklin Limited Duration Income Trust | 1.4% | 0.0765 | 0.0776 | 10.84% | -6.53% | 0.1 | 53% | 9/18/2020 | 9/29/2020 | |
MFS® Charter Income | 1.5% | 0.05825 | 0.05911 | 8.74% | -6.88% | -0.2 | 51% | 9/1/2020 | 9/15/2020 | |
Eaton Vance Floating-Rate Income | 1.6% | 0.061 | 0.062 | 6.22% | -13.20% | -0.5 | 101% | 9/1/2020 | 9/22/2020 | |
MFS Special Value | 2.0% | 0.04323 | 0.04411 | 10.01% | 1.73% | -0.7 | 27% | 9/1/2020 | 9/15/2020 | |
Delaware Investments Dividend & Income | 2.4% | 0.054 | 0.0553 | 8.14% | -7.39% | -1.2 | 40% | 9/1/2020 | 9/17/2020 | |
MFS® Intermediate High Income | 2.6% | 0.01884 | 0.01933 | 9.87% | -2.08% | -0.3 | 59% | 9/1/2020 | 9/15/2020 | |
Eaton Vance Float-Rate 2022 Target Term | 2.8% | 0.036 | 0.037 | 5.05% | -2.01% | 0.4 | 98% | 9/1/2020 | 9/10/2020 | |
Delaware Enhanced Global Div and Inc | 2.9% | 0.0513 | 0.0528 | 7.14% | -9.49% | 0.3 | 50% | 9/1/2020 | 9/17/2020 | |
Vertical Capital Income Fund | 3.8% | 0.026 | 0.027 | 3.26% | -17.52% | 0.5 | 89% | 9/8/2020 | 9/17/2020 | |
Federated Premier Municipal Income | 8.0% | 0.05 | 0.054 | 4.51% | -5.65% | 1.4 | 95% | 9/10/2020 | 9/22/2020 | |
The India Fund Inc | 9.5% | 0.42 | 0.46 | 11.10% | -15.07% | -1.2 | -1% | 9/10/2020 | 9/18/2020 | |
Morgan Stanley Emrgng Mkts Domestic Debt | 10.0% | 0.1 | 0.11 | 7.90% | -17.24% | -0.8 | 32% | 9/18/2020 | 9/29/2020 | |
Templeton Emerg Mkts Income | 12.4% | 0.0355 | 0.0399 | 6.48% | -16.40% | -1.2 | 90% | 9/1/2020 | 9/14/2020 | |
Morgan Stanley Emerging Markets Debt | 12.8% | 0.0975 | 0.11 | 5.26% | -16.98% | -1.3 | 31% | 9/18/2020 | 9/29/2020 | |
Eaton Vance Senior Income | 12.9% | 0.031 | 0.035 | 7.14% | -9.12% | 0.6 | 77% | 9/1/2020 | 9/10/2020 |
CEF analysis from around Seeking Alpha...
ADS Analytics presents PIMCO August Coverage And Shareholder Report Update (Sep. 28)
Alpha Gen Capital presents PIMCO Gives Investors Another Scare (Sep. 28), Fund Spotlight: DoubleLine Yield Opportunities - This New Fund Looks Attractive (Sep. 28)
Double Dividend Stocks presents BlackRock Science And Technology Trust: Tech Monthly Payer, 12% Dividend Growth (Oct. 2)
George Spritzer presents JCE Looks Attractive Here With A 7.2% Distribution Yield And A 9.4% Discount (Sep. 26)
*Nick Ackerman presents KIO: High-Yield, High-Risk 'Dynamic' Credit Fund (Sep. 28), FFC: Providing Attractive Monthly Income, Yielding 7.46% (Sep. 29), EOS: A Covered Call Fund That Has Been On Fire (Sep. 30), CSQ: An Attractive Monthly Paying Fund With An 8.37% Yield (Oct. 1), ETG: Consistent Dividend Payer At A Wide Discount (Oct. 1), BUI: Sheltered From The Storm (Oct. 2)
*Stanford Chemist presents Weekly Closed-End Fund Roundup: September 20, 2020 (Sep. 29), Closed-End Fund 'Quality' Report: September 2020 (Sep. 30)
Trapping Value presents RA: Real Assets But Fake Yield (Oct. 1)
*To subscribers: these link to the public version of the article, which you will already have seen in the members section.
Macro/market section
Fear & Greed Trader presents S&P 500 Weekly Update: An 'October Surprise' Doesn't Change The Market Outlook (Oct. 3)
Jeff Miller presents Weighing The Week Ahead: Should Investors Change Course Because Of The POTUS Diagnosis? (Oct. 4)
Profitable CEF and ETF income and arbitrage ideas

Closed-end funds news and recommendations are now exclusive to members of CEF/ETF Income Laboratory. We also manage market-beating closed-end fund (CEF) and exchange-traded fund (ETF) portfolios targeting safe and reliable ~8% yields to make income investing easy for you. Check out what our members have to say about our service.
To see all that our exclusive membership has to offer, sign up for a free trial by clicking on the button below!

Disclosure: I am/we are long BMEZ, OCCI, OXLC, XFLT. I wrote this article myself, and it expresses my own opinions. I am not receiving compensation for it (other than from Seeking Alpha). I have no business relationship with any company whose stock is mentioned in this article.