
SPY: The End Of This Correction
So far the SPY (NYSEARCA:SPY) has had a normal correction after an enormous move up from the bottom of a market crash to a rather surprising new high. This move was fueled by extreme fiscal and monetary stimulus. The latest stimulus package is stalled in Congress and the market move up is also stalled. Interest rates are about as low as they can go. However, the Fed still has other tools to prevent a financial collapse. Congress will eventually pass the next stimulus package. The worst-case scenario sees the market only stabilized and testing the old high. The best-case scenario sees a breakout to a new high sometime next year.
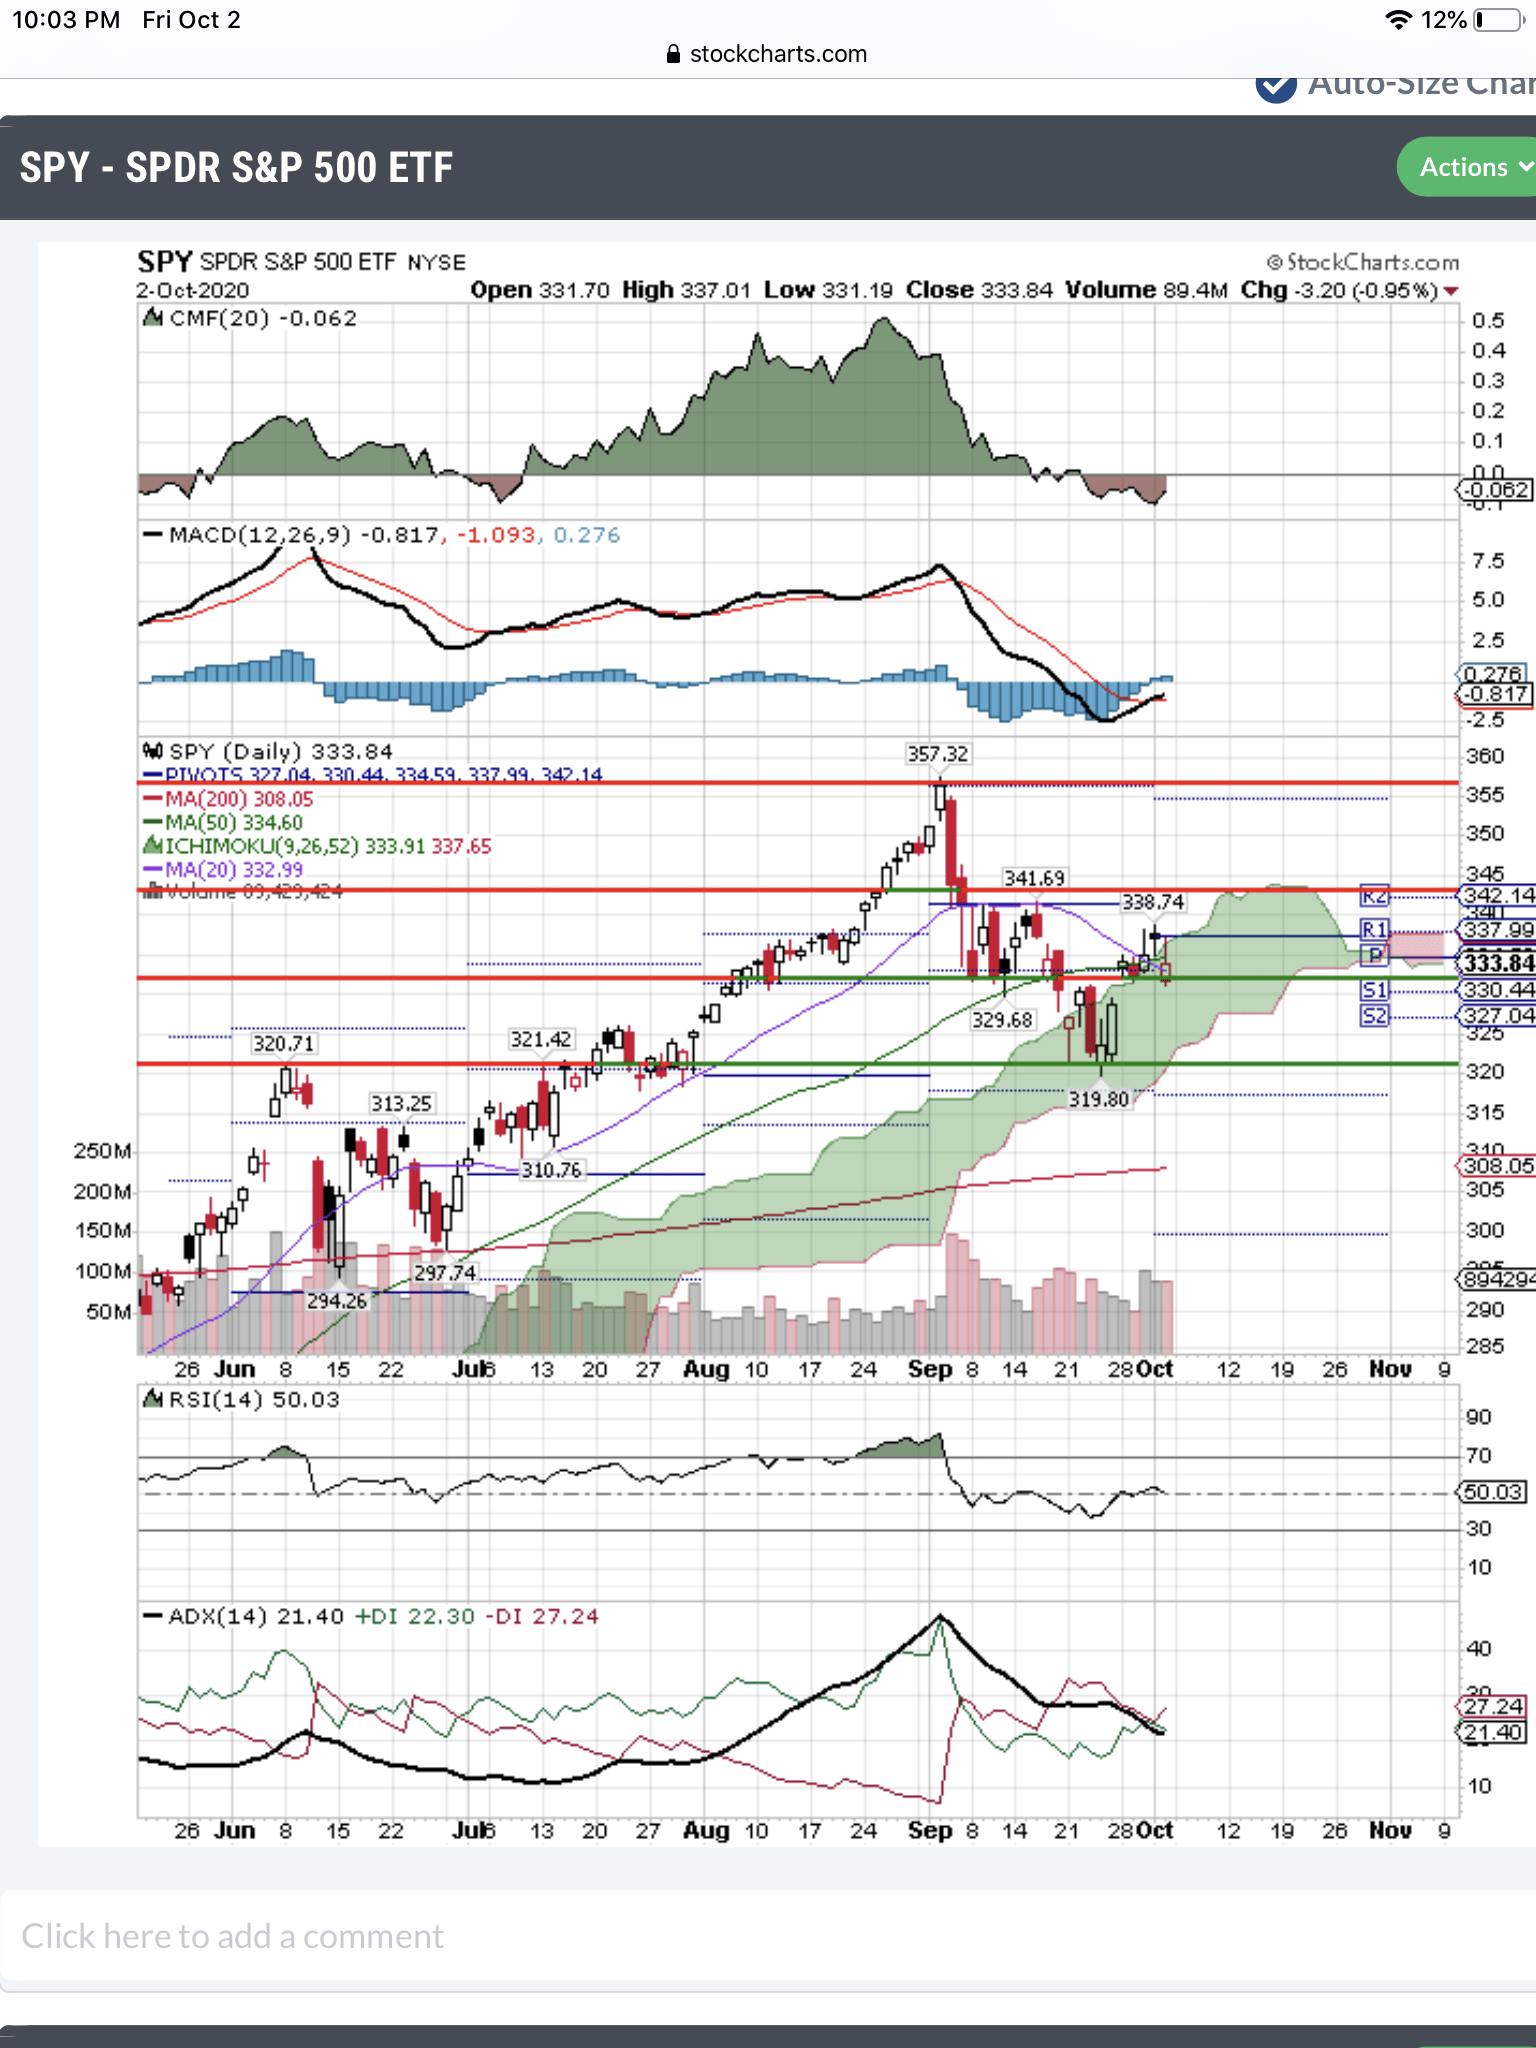
Here's the daily chart just to show the latest upside testing, its failure and now the move down to retest previous levels.
You can see the first test of $341 that failed and now the second failure at $339. Friday it closed at a $334 support level. The other signals are weak and were attempting to turn up before Friday’s bad news. You also can see the 20-day moving average breaking below the 50-day moving average and I call this the “sick” cross. The death cross is the name given to the 50-day crossing below the 200-day.
The weekly chart removes the daily gyrations and emotions and provides slower, but more reliable signals for decision making about where the SPY is going. Let’s take a look at it:
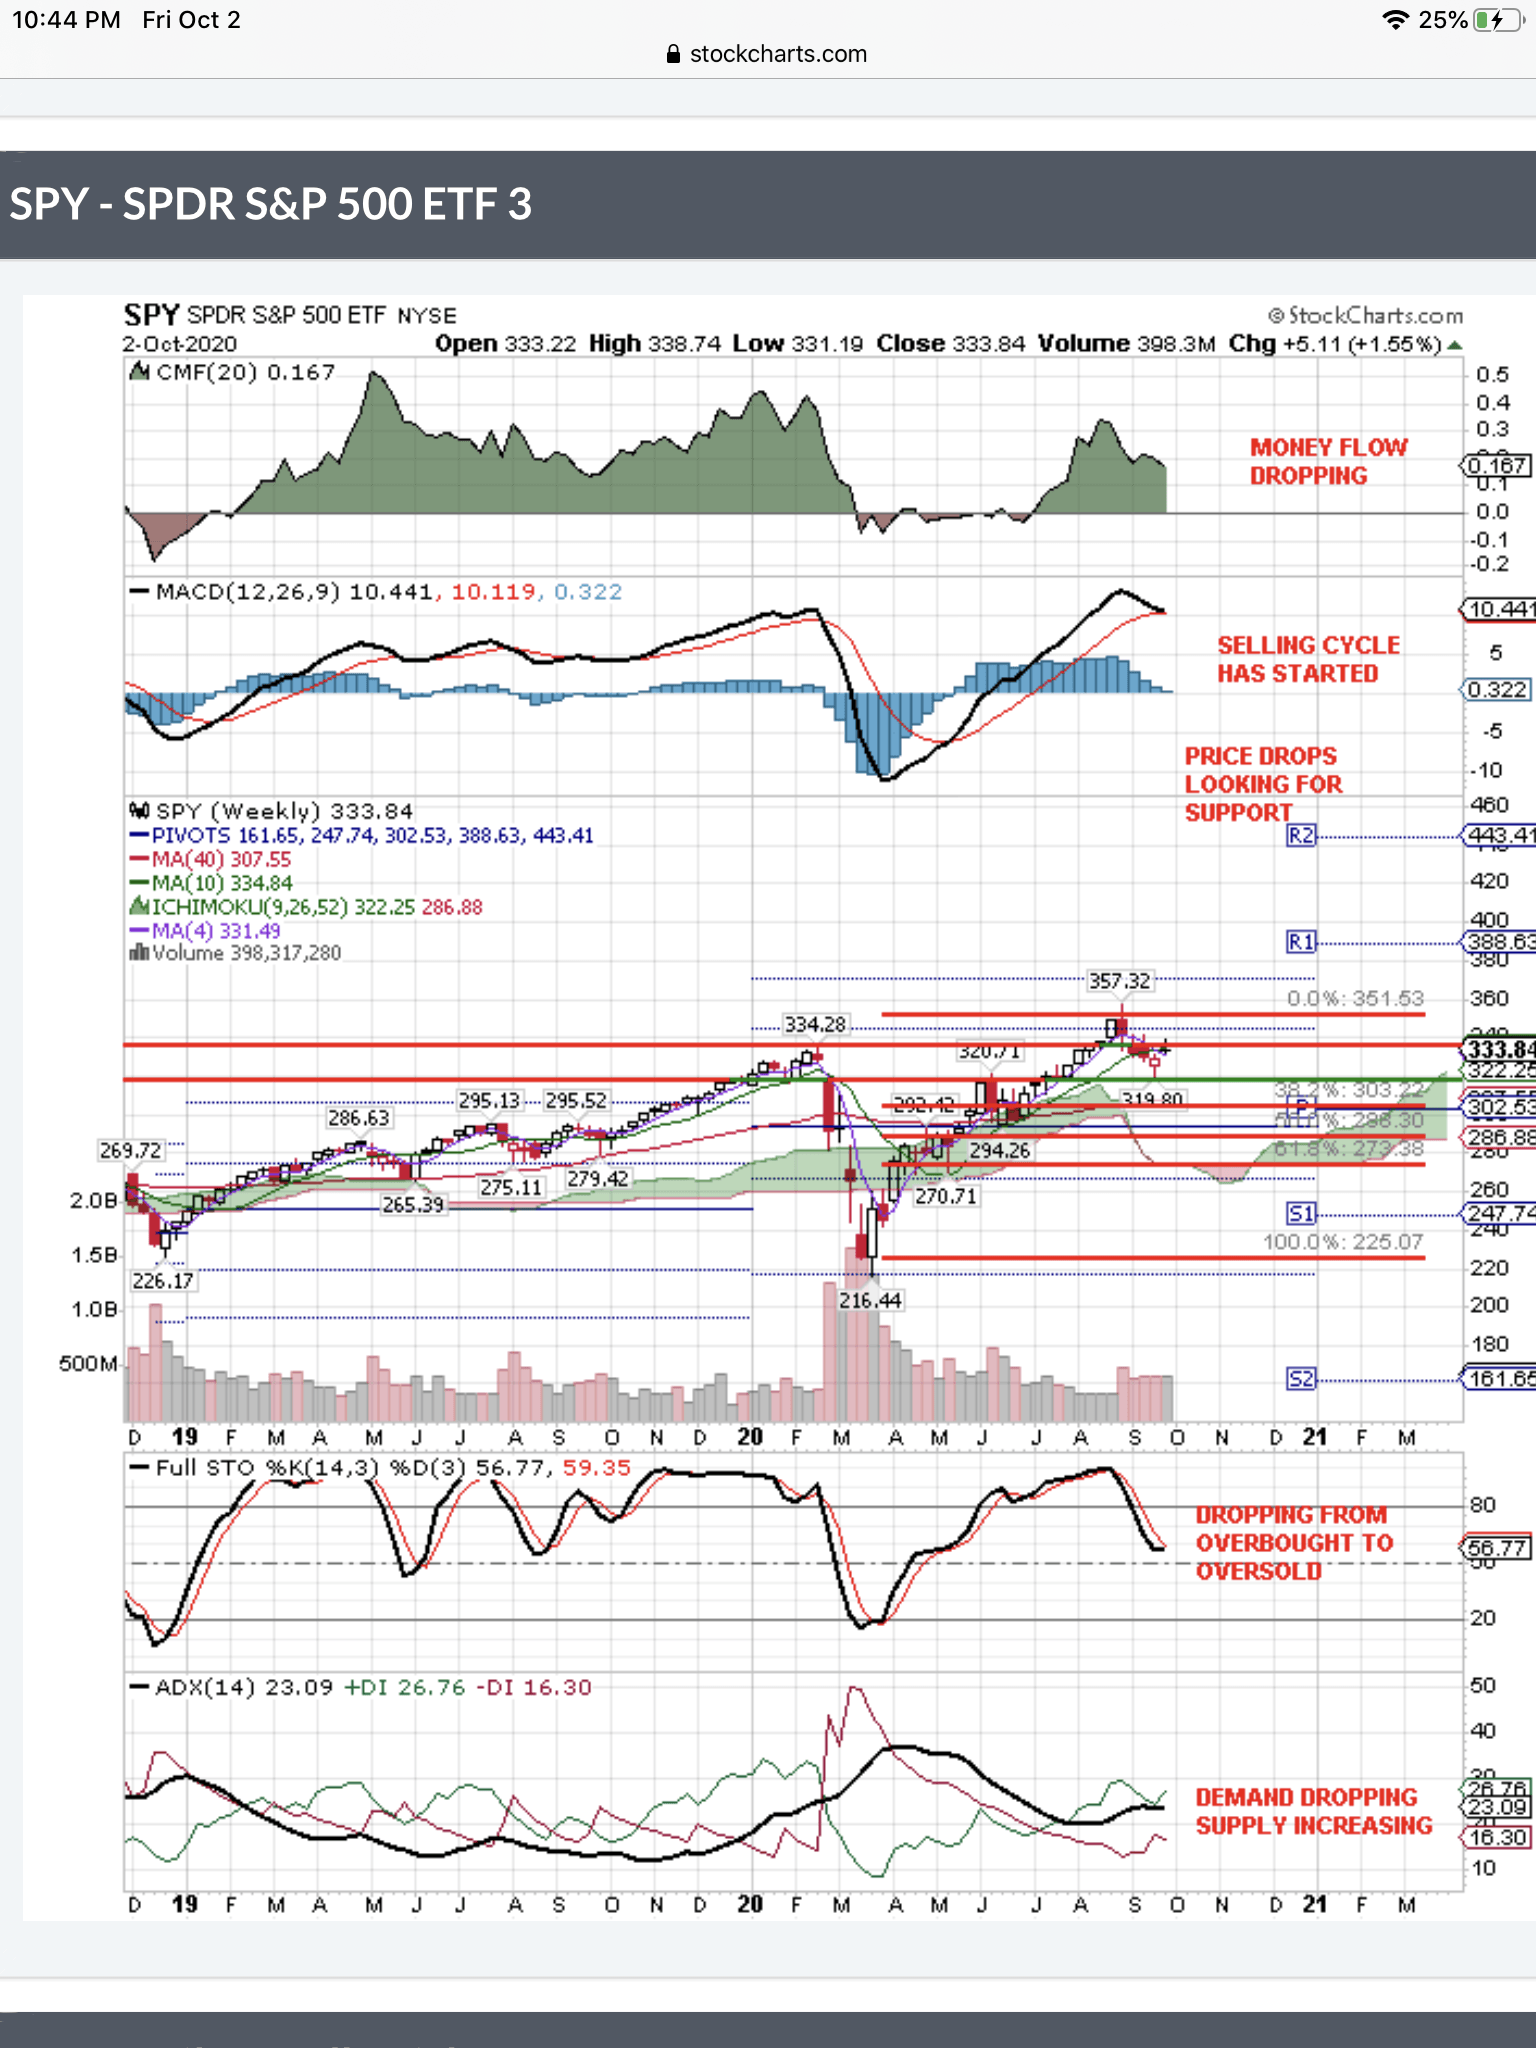 As you can see, all of the signals are down, just as you would expect during a correction in the market. You can see the break below the major, pre COVID-19 high, support level at $334. The attempt to stay above that important level just failed. The next target seems to be a retest of the previous drop to $320.
After a gigantic move up from the bottom it's not unusual to retrace 50% of the move up. That level is shown on the chart to be $288. It's also not unusual for the SPY to retest the 40-week moving average and that is currently at $308. That's why the break below $320 will be bearish, because it will open the gate to these lower levels.
The signals on the daily chart “lead” the signals on the weekly chart. Likewise the weekly chart leads the very slow moving signals on the monthly chart. However, the monthly chart has the advantage of clarifying the ultimate target of this pullback. Let’s look at it:
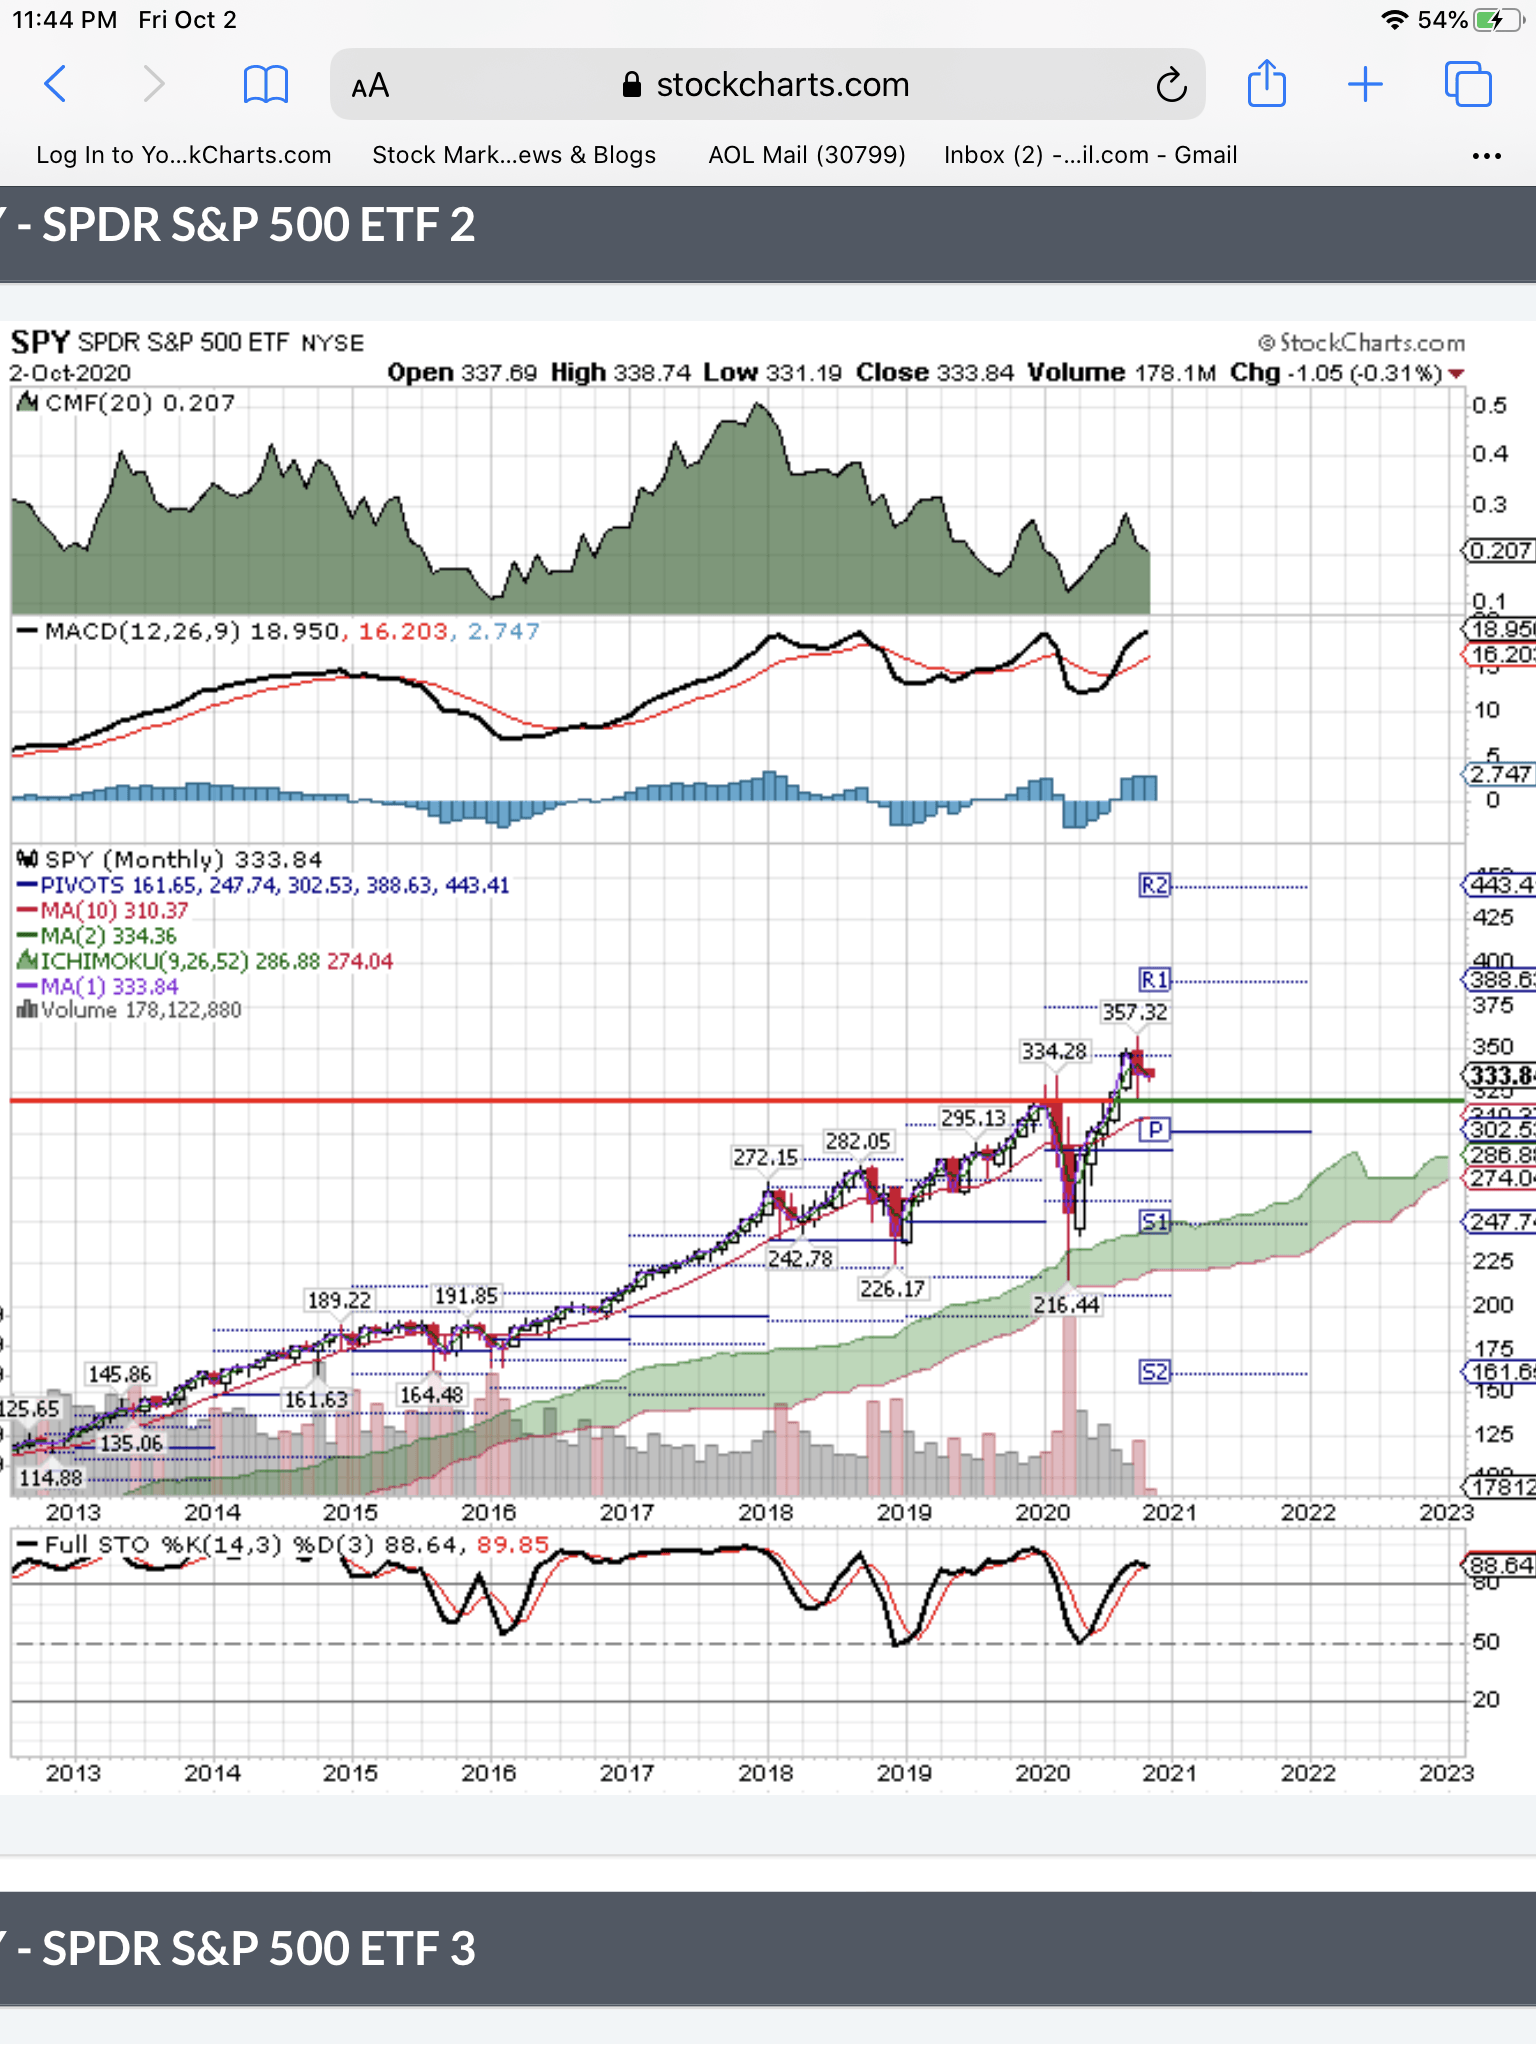 It looks as if that $320 line is the target of this pullback. It would take a negative surprise to the current market view to break below this level. The retest of this level will give us the answer. We will find out if it holds as it did last time.
Conclusion
The market hates uncertainty. The president’s condition is uncertain. The stimulus package is uncertain. The election is uncertain. The economy is uncertain. October is usually a bad month. However, November starts the best six months of the market. The unemployment rate has dropped. The election will be over in November. The stimulus package will pass after the election, if not before. Short term this market continues to test $320. Longer term the uncertainty is resolved. We think a negative surprise will take the SPY down to $310, a positive surprise will take it above $340. We continue to rate the SPY bearish.

Use our free, 30 day training program to become a succesful trader or investor.
Disclosure: I/we have no positions in any stocks mentioned, but may initiate a short position in SPY over the next 72 hours. I wrote this article myself, and it expresses my own opinions. I am not receiving compensation for it (other than from Seeking Alpha). I have no business relationship with any company whose stock is mentioned in this article.
Additional disclosure: Disclaimer: We are not investment advisers and we never recommend stocks or securities. Nothing on this website, in our reports and emails or in our meetings is a recommendation to buy or sell any security. Options are especially risky and most options expire worthless. You need to do your own due diligence and consult with a professional financial advisor before acting on any information provided on this website or at our meetings. Our meetings and website are for educational purposes only. Any content sent to you is sent out as any newspaper or newsletter, is for educational purposes and never should be taken as a recommendation to buy or sell any security. The use of terms buy, sell or hold are not recommendations to buy sell or hold any security. They are used here strictly for educational purposes. Analysts price targets are educated guesses and can be wrong. Computer systems like ours, using analyst targets therefore can be wrong. Chart buy and sell signals can be wrong and are used by our system which can then be wrong. Therefore you must always do your own due diligence before buying or selling any stock discussed here. We assume no liability for erroneous data or opinions you hear at our meetings and see on this website or its emails and reports. You use this website and our meetings at your own risk.