
SPDR Dow Jones ETF: History Is On Its Side
Just a few days ago, I wrote an article about the Dow Jones Industrial Average (DIA) defending the idea that diversifying out of the Nasdaq 100 (QQQ) and into "old economy" and cyclical stocks finally makes sense to me. At the heart of the thesis is the fact that:
- after the recent change in allocation to Apple (AAPL), DIA has become a significantly different fund that can better help to diversify a stock portfolio;
- following an epic rally in 2020, QQQ has raised enough yellow flags recently to suggest that it may be on the brink of a more painful correction ahead.
In re-reading my own work, a question has popped into my mind. What does history say about selling an overstretched Nasdaq and buying an underappreciated Dow? Has the strategy worked before?
This is "part two" of my DIA study.
Credit: Stock Master
History overwhelmingly favors the Dow
At first thought, it makes sense to me that a tech-rich portfolio that is more susceptible to momentum buying and selling would go through overbought and oversold cycles. Just think of the dot-com bubble burst, and consider how the Nasdaq being up 110% in only twelve months, starting in March 1999, or down 70% in the following eighteen months both seemed like exaggerated moves. Theoretically, some sort of return to normal from such extreme levels needs to take place. At least this is my thesis.
So I started to plug in the numbers. As far back as I could find reliable data on daily prices, I calculated the following:
- the difference in historical returns between the Dow Jones and the Nasdaq 100 over a rolling period of 24 months for each day since 1985;
- the difference in forward-looking returns between the Dow and the Nasdaq over a rolling period of 24 months, also for each trading day.
With the information above, I created a scatter plot that helped me to answer the following question: is there any evidence that the Dow tends to outperform the Nasdaq after a period of underperformance, as we have seen in the past several months or even years? Or are past results largely useless in predicting future Dow vs. Nasdaq trends?
To address this question, I must first show the ugliest graph that the reader will probably lay eyes on today:
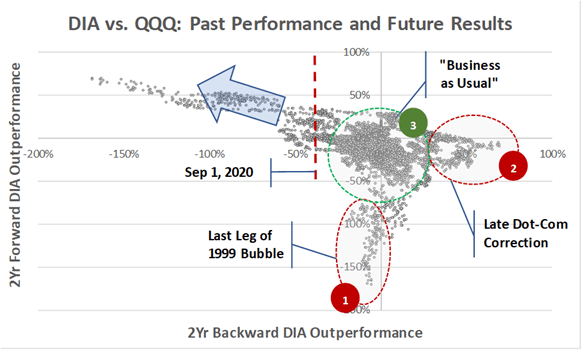
Source: DM Martins Research, data from Yahoo Finance
The x-axis is the outperformance (if positive) or underperformance (if negative) of the Dow Jones against the Nasdaq over a previous period of two years. The y-axis is the outperformance (if positive) or underperformance (if negative) of the Dow Jones against the Nasdaq over a forward-looking period of 2 years.
Notice the three dotted circles. In the middle, in green and labeled "circle 3", is the relationship between past and future performance of the Dow vs. Nasdaq when neither has outperformed the other in the recent past by a very wide margin. In other words: under somewhat normal circumstances, looking back seems to have done little to help predict the future.
The two dotted circles in red are outliers or anomalies created by the late 1990s tech bubble. At the end of the quick inflationary cycle, mostly in 1999, the Dow kept underperforming as the Nasdaq continued to push forward for a multi-year period of time ("circle 1" above). At the end of the dot-com correction, the Dow had been lavishly beating the Nasdaq for quite a while before things normalized again and tech began to perform better ("circle 2").
The important part of the graph is the top left, under the transparent blue arrow. The wider the outperformance between the Nasdaq over the Dow, the more likely it is that the Dow will outperform over the following couple of years, in true mean-reversion fashion (notice the very large r-squared). This is the historical evidence that I expected to see that an overstretched Nasdaq, after being pushed much higher by momentum and enthusiasm, eventually pulls back sharply relative to the Dow.
Let's zoom into this specific part of the graph. See below.
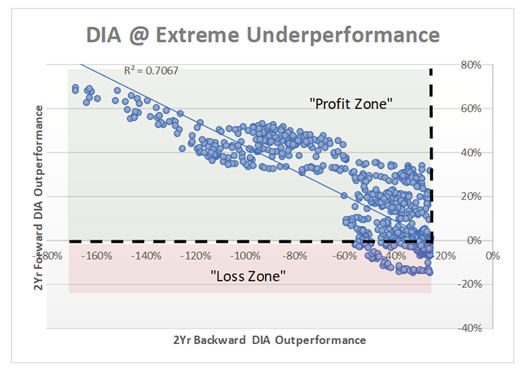
Source: DM Martins Research, data from Yahoo Finance
The chart above looks only at the instances in which the Nasdaq had been outperforming the Dow over the previous 24 months by a cumulative 25 percentage points or more. When this happened, mostly in 1992-1993 and around 2000, the Dow almost always sprung back over the following 24 months. The gains of a long-Dow, short-Nasdaq strategy in these cases have, historically, far outweighed the losses.
Just two weeks ago, the Dow had been underperforming the Nasdaq by nearly 40 percentage points over the previous 24 months. Looking at the graph above, the Dow has hardly ever underperformed the Nasdaq over the following two years when something like it happened before. Of course, it is about two years too early to tell whether 2020 will see history repeat itself. But if you ask me, I'd bet some of my money that it will.
Final words
No one knows what the future holds. But I continue to stumble upon evidence that DIA may be the best group of stocks to invest in today, given a sufficiently long time horizon of something between one and three years.
Stocks have been on a choppy ride recently, and the future looks even more uncertain. But all my SRG portfolios have been beating the S&P 500 in 2020 and since inception, while also producing far superior risk-adjusted returns. To find out how I have created a better strategy to growing your money in any economic environment, click here to take advantage of the 14-day free trial today.

Disclosure: I am/we are long AAPL. I wrote this article myself, and it expresses my own opinions. I am not receiving compensation for it (other than from Seeking Alpha). I have no business relationship with any company whose stock is mentioned in this article.