
FFC: Providing Attractive Monthly Income, Yielding 7.46%
Written by Nick Ackerman, co-produced by Stanford Chemist
The Flaherty & Crumrine Preferred and Income Securities Fund (FFC) is currently trading around its average premium. This has come as the volatility of the last couple of weeks has brought the double-digit discount to a mid-single digit premium of 5.62%. Funds are generally avoided if they are trading at premium levels, though along with being around its 1-year average, this fund also even longer-term trades at slight premiums. That puts FFC at a place where an investor can feel comfortable holding or even adding a little bit during this time of volatility.
As for members of the CEF/ETF Income Laboratory, we have held FFC in the past. Currently, we are holding a similar fund, the Flaherty & Crumrine/Claymore Total Return Fund (FLC). This came after a swap trade from Flaherty & Crumrine Dynamic Preferred and Income Fund, Inc. (DFP) when the valuation levels presented an opportunity. Today, all three of these similar funds are trading around the same level of premium.
The investment objective of FFC is "to provide high current income consistent with preservation of capital." What I find interesting about this is that this is my primary objective as well. Many funds put in the objective of high income, though their secondary is generally capital appreciation. Capital growth on the fund level is a bonus if it happens. However, for CEFs, just maintaining the current NAV, within reason, is generally all I'm looking for.
Flaherty & Crumrine has a history working in the preferred security space, with the firm being founded in 1983. The firm mentions that it had its "first closed-end fund launched over 25 years ago." This would include both its oldest CEF that exists - Flaherty & Crumrine Preferred Income Fund (PFD), launched in 1991, and the Flaherty & Crumrine Preferred Income Opportunity Fund (PFO), launched in 1992. Checking out PFD's website and PFO's website - they have preserved the '90s website feel as well! In the end, though, this provides a good long-term track record for the fund sponsor.
FFC is a large fund at over $1.3 billion in managed assets. It utilizes leverage of around $450 million or 34.23%. This can increase risks to the downside. This was especially an issue during the March panic selling that hit the portfolio hard because of liquidity issues preferred securities went through - then that was on top of the added volatility of leverage. This helped propel the fund higher though, too, during the rebound that ensued.
The fund charges a very reasonable 0.87% expense ratio, and when including leverage, this climbs to 2.52%.
(Source)
Performance - Strong Preferred/Fixed-Income Returns
As mentioned briefly, the liquidity issue that hit preferred and fixed-income investments during the March panic selling didn't spare FFC.
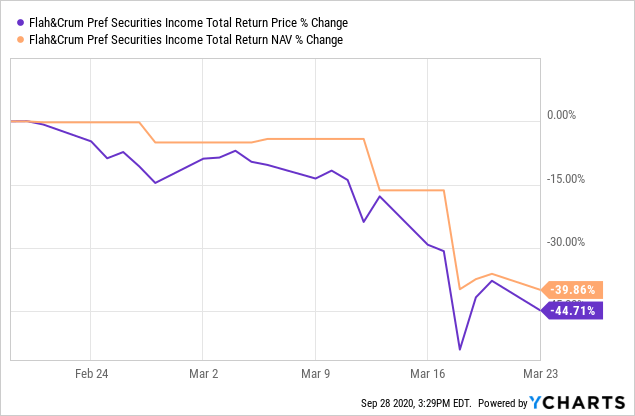
From February 19th, 2020 to March 23rd, 2020, the fund experienced a drop of almost 40%. Surprisingly, the share price didn't drop all that much further than the NAV.
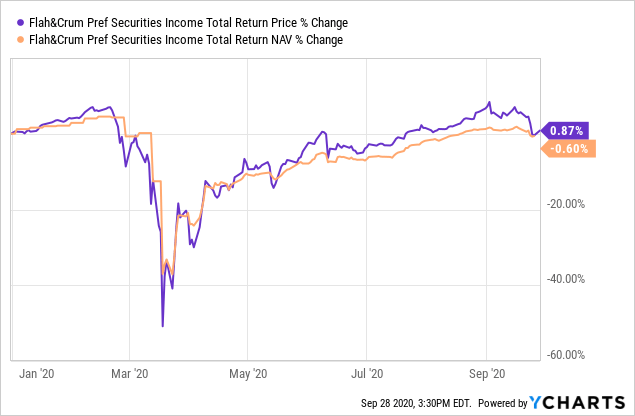
Considering that plummet, the returns haven't looked too terrible on a YTD basis, recovering much of the drop to hit around flat returns for the year. This was looking even better before the latest few weeks of volatility have once again been hitting the market. As we head into the election in November, we can anticipate even more volatility ahead. Though once an outcome is known, we could start to see some milder market moves. If this is coupled with a vaccine, we could be set for new highs as well, or at least not the same volatility we have been going through.
For a preferred and fixed-income fund, FFC has put up considerable returns over the longer term as well. This is thanks to the leverage the fund uses, at least partially. The superior management of the fund potentially plays a role as well, as we see it outperform others.
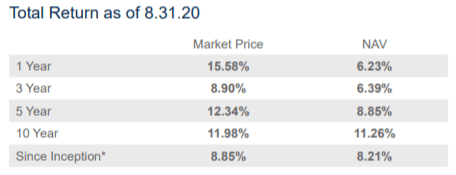
(Source: Fund Fact Sheet)
For peer comparisons, we can use the iShares Preferred and Income Securities ETF (PFF), the John Hancock Preferred Income Fund (HPI) and the Nuveen Preferred & Income Opportunities Fund (JPC).
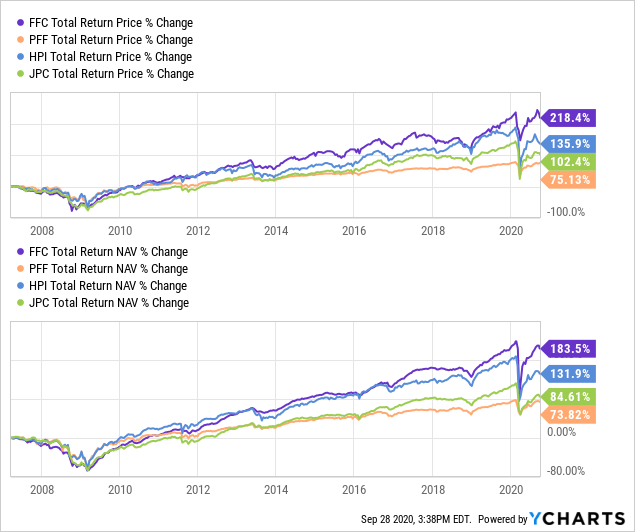
These funds provide a mixture of different fund sponsors to benchmark performance. As we can see, FFC blows them out of the water. That isn't to say that I don't respect funds from John Hancock or Nuveen, as I own several. However, at least the historical track record has them easily outpacing the others. HPI was somewhat holding its own before the last crash, but FFC has really rebounded so much stronger.
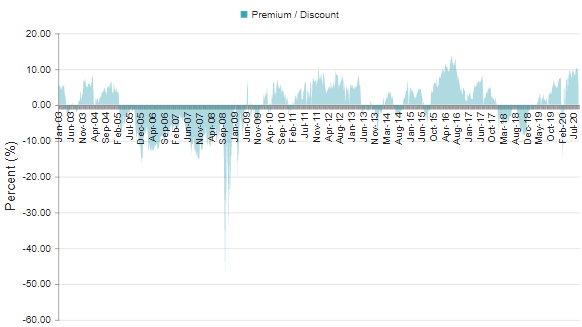
The downside to all of this is that the fund trades at a mid-single digit premium. Currently, this is 5.62%. We can compare this with the 1-year average of 5.93% and the 5-year average of 2.99%. In that context, the current level isn't completely out of the ordinary.
(Source: CEFConnect)
Going back even further, over the last 10 years, the fund has enjoyed premium pricing too.
Distribution - Boosts From This Fund Sponsor
(Source - CEFConnect)
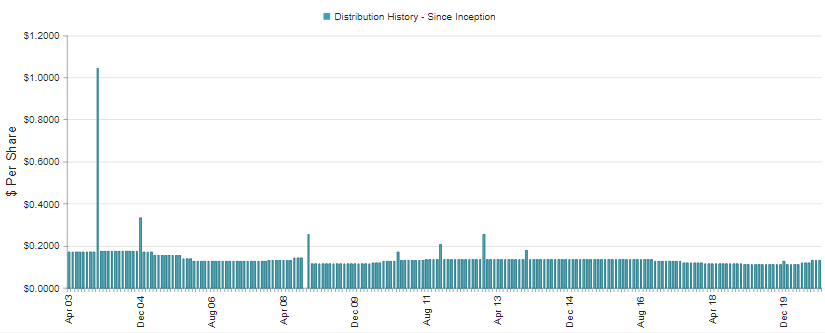
The biggest highlight for the F&C funds is that they have been boosting their distributions over the last couple of quarters. The fund sponsor cited interest rate targets of 0% by the Fed lowering its expenses. Interest expenses from its May 31st, 2019 report came to $4,670,473 for a 6-month period. This was a steep drop from last year's same 6-month period of $7,408,297. Hence, it had a higher amount of net investment income to distribute. The fund currently has a distribution rate of 7.46%. Due to the premium pricing, its NAV distribution is 7.99%.

(Source: Semi-Annual Report)
Take note, that was for only a 6-month period as well. The interest expense is likely to drop a bit further when the fund reports a full 6-month period of 0% interest rates. This also came as the fund did not decrease leverage either - it was at the same $449,575,000 amount. The latest NII was an almost 9% increase from last year's number. Essentially, NII is what "earnings" are for a fixed-income CEF.
Based on the latest monthly distribution of $0.1290 and shares outstanding of 44,487,462, FFC should pay out total distributions of $68,866,592 for an annualized period. Based on the latest NII report, if we annualized that, we would arrive at NII coverage of around 91%. However, keep in mind that NII should climb even a bit more from the last period. Even a small shortfall could be potentially covered by some capital gains if the fund can maneuver its preferred portfolio successfully. Though, as a primarily fixed-income type fund, we are encouraged to see high NII coverage.
The caveat here is that we don't know exactly how many shares outstanding FFC will end up with. As the fund trades at premium levels and offers a DRIP, it issues new shares every time a distribution is made.
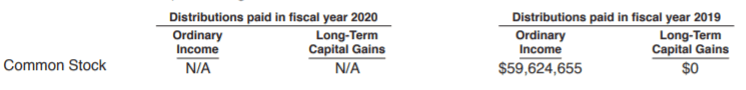
Last year's tax characteristics for the distributions were all classified as ordinary income. Of that, 82.7% was considered qualified income that lowers tax obligations for investors.
(Source: Semi-Annual Report)
Holdings - Strong Portfolio Of Reliable Companies
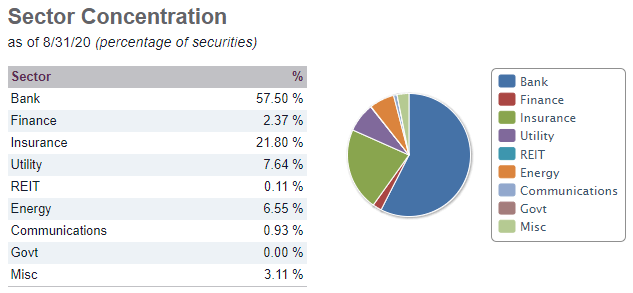
It isn't too much of a surprise, but FFC has a strong tilt towards the financial sector. This is because the largest sector to issue preferred securities is from the financial sector. This helps with the capital ratio requirements from regulators.
(Source: Fund Website)
While bank common stock is getting hit hard this year, preferred stocks have predominately bounced back from their lows. During the March panic, investors with margin calls were selling anything they could get their hands on. Additionally, preferred stock traditionally has less volume, so liquidity becomes an issue. This happens when there isn't an appropriate balance between buyers and sellers.
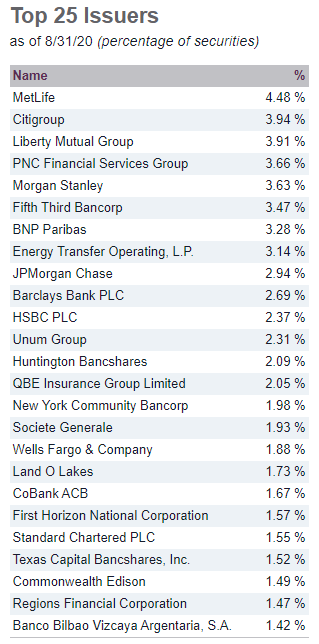
FFC lists its top 25 issuers, all but a few of which operate in the financial sector. Additionally, these are large banking institutions and the majority can be easily recognized. These large-cap companies should offer more stability overall. Not to mention, besides the top half of the list, no one single company holds a large portion of the fund's portfolio.
(Source: Fund Website)
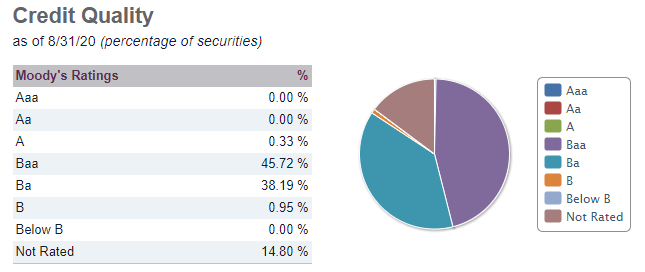
These larger, more well-known companies are also reflected, as the credit rating of FFC's portfolio is more skewed towards investment-grade. This can further provide better "sleep well at night" for investors. Though this is balanced a bit by a large portion being just under investment-grade as well, or "junk status."
(Source: Fund Website)
To zero in a bit on some of the underlying positions, we can refer to the fund's latest Semi-Annual report that provides a bit more color on the positions. However, keep in mind that plenty of its portfolio is in private placement investments - investments that aren't available for the typical retail investor. This can be both a benefit and a negative, depending on how one looks at it. The benefit is that investors are gaining exposure to something they otherwise wouldn't as a retail investor. The other side of this, though, is that less information is generally available to gather.
For FFC, level 1 assets are still the dominant investment at around 61% of their portfolio, though that leaves the other ~39% in level 2. Level 2 assets don't typically have the worry that a level 3 asset does, as level 2 assets still mean there are "significant observable inputs." Meaning that the "true value" of the investment is quite accurate.
The largest holding, Metlife (MET), is through three separate investments - a 9.25% due 4/08/38, a 10.75% due 08/01/39 and MetLife Capital Trust IV, 7.875% due 12/15/37. These are all quite high-yielding offerings. Again, one of the benefits of having exposure to these types of securities that wouldn't normally be available.
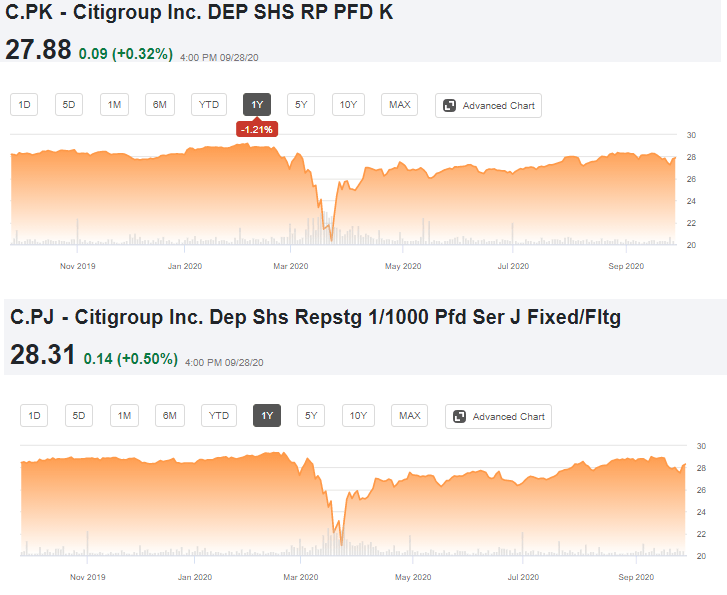
The second-largest exposure is to Citigroup (C.PK). This comes through four different offers that are even a bit more complex. They include these descriptions: 4.70% to 01/30/25 then SOFRRATE + 3.234%, Series V, 5.95% to 05/15/25 then 3ML + 3.905%, Series P, 6.875% to 11/15/23 then 3ML + 4.13%, Series K and 7.125% to 09/30/23 then 3ML + 4.04%, Series J.
In this case, Citigroup provides a convenient and compiled list of series that are traded on exchanges and those that are not listed. The Series V and Series P are not listed, while Series K and Series J are listed. That is where we can see that the Series K and Series J are traded well above par currently, rebounding massively from March's lows.
(Source: Seeking Alpha)
Conclusion
Flaherty & Crumrine offer a solid line-up of preferred closed-end funds. They currently all trade around the same premium levels. Though there are times that we can take advantage and trade between the funds, selling those that are at elevated premium levels and purchasing the lower-valued funds.
The line-up of funds has also all benefitted lately from lowered interest rates. As the Fed is now targeting 0% interest rates, this lowered the expenses quite significantly for the funds. This resulted in the fund managers increasing distributions over the last couple of quarters.
Even if an investor doesn't participate in swap trades that can potentially add alpha, this still means they can benefit from these increased distributions. At FFC's current 7.46% yield that is paid monthly, one is getting paid quite respectably. The monthly frequency has been in place since its inception, surviving two crisis events. Even being heavy in the financial sector didn't prove to be too long-term damaging during the GFC. Though the preferred focus had presumably helped it survive much better than its common stock peers.
Profitable CEF and ETF income and arbitrage ideas
 At the CEF/ETF Income Laboratory, we manage ~8%-yielding closed-end fund (CEF) and exchange-traded fund (ETF) portfolios to make income investing easy for you. Check out what our members have to say about our service.
To see all that our exclusive membership has to offer, sign up for a free trial by clicking on the button below!

Disclosure: I am/we are long FLC. I wrote this article myself, and it expresses my own opinions. I am not receiving compensation for it (other than from Seeking Alpha). I have no business relationship with any company whose stock is mentioned in this article.