

CII: Tech-Heavy Portfolio Yielding 6.74%
Written by Nick Ackerman, co-produced by Stanford Chemist
BlackRock Enhanced Capital and Income Fund (CII) provides an overweight to the attractive growth names of tech. However, to keep it more defensive, the fund utilizes an option strategy and offers exposure to a more diversified group of assets. As volatility has increased in the tech space (though we have seen up, up and up again after the brief stint), this could be a name worth watching. Even now, the fund's discount is wider than it historically has been.
CII is held in our Income Generator portfolio, where it has been held since earlier this year. Though we did reduce the position by swapping some of it to BlackRock Enhanced Equity Dividend Trust (BDJ) just a few short weeks later.
CII has an investment objective of "a combination of current income and capital appreciation." They will attempt to achieve this through "investing primarily in a diversified portfolio of common stocks in an attempt to generate current income and by employing a strategy of writing (selling) call options on equities in an attempt to generate gains from option premiums."
Their option strategy generally stays within 30 to 40% of assets, though the latest amount they had was 51.70%. These are single stock options so they are written against positions owned in the portfolio. The greater portion being overwritten could indicate that they are being relatively more defensive.
The fund manages total assets of $763.6 million. The expense ratio of the fund is a very reasonable 0.91%.
(Source)
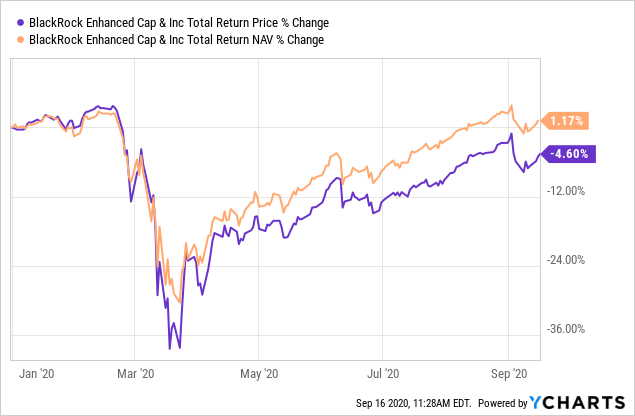
Performance - Overweight Tech Helps Stave Off Negative Total NAV Returns
On a YTD basis, the fund is struggling to produce a positive total share price return. Though the overweight tech has helped mitigate some of the worst of the losses, with the total NAV return coming slightly positive.
More recently, the volatility that we experienced helped to drop this fund back to a historically wide discount for the fund. The current discount of 9.58% is about as wide of a discount as the fund has experienced since 2008/09.
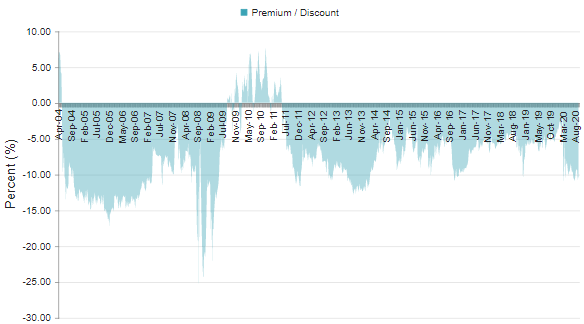
(Source - CEFConnect)
Though before those severe discounts experienced in 2008/09, the fund had been trading at a wide discount. Though over the last year, the average had been 7.27%, working out to a z-score of -1.14. Further, the 5-year average discount is 6.55%. This places the fund at a very enticing discount for investors looking to scoop up shares.
Over the longer term, the fund has put up respectable returns as well. You won't beat the S&P 500 (SP500) with this fund, but you also wouldn't be collecting an attractive monthly income either with that index. The numbers provided below were as of June 30th, 2020 - so the returns have improved even more since that reporting period.
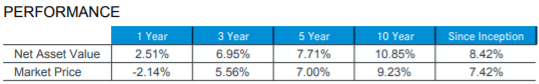
(Source - Fund Fact Sheet)
Distribution - Strong And Reasonable Distribution Yield
The fund currently sports a distribution yield of 6.74%. This is paid monthly via a $0.0875 per share amount. Thanks to the hefty discount, the underlying fund only has to generate a 6.10% return from here to cover what they are paying out. This can help explain why the fund had boosted the distribution late last year. Though we have had a tumultuous period since then, I believe the distribution rate is still quite solid.
Since they are an equity fund, they will rely on quite a significant portion of capital appreciation to fund their distribution. This is evidenced by the fund's net investment coverage of 17%.
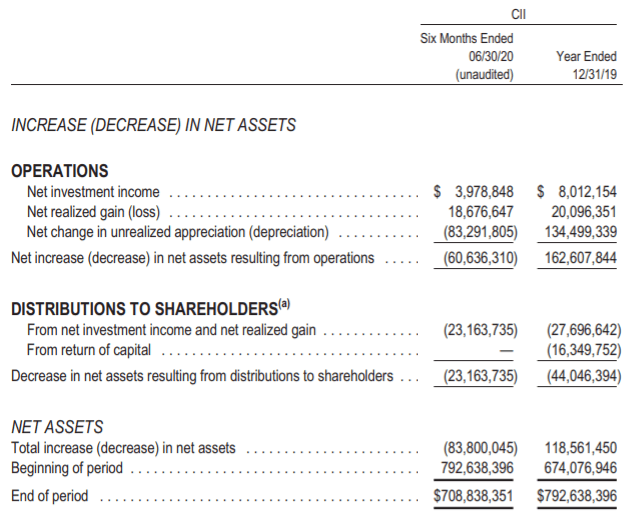
(Source - Semi-Annual Report)
This isn't a cause for panic, even as it would appear the NII coverage has dropped from around 29% in the prior year. This drop in coverage was caused by both a small decline in NII and by the increased distribution.
As we can see, for 2019, the fund had classified some of its distribution as ROC as well. This was not destructive ROC in this case as the fund soared last year (along with the rest of the market). This was a case of the portfolio's unrealized appreciation of $141.6 million - but they only turned roughly $36.5 million of these into realized gains with their options writing generating an almost $16.5 million loss. Thus, the realized gains amounted to roughly $20 million - then tacking on roughly $8 million in NII, and we can see where this ROC came from.
The safety of their distribution is further reinforced as the fund is sitting on $150 million in unrealized appreciation. Though this has since increased since they last reported this on June 30th, 2020.
The tax characteristics can be seen below for the following two years. ROC was a large component of 2018, where 2018's ROC was technically destructive. This was because the fund's NAV fell from the beginning of the year to the end, meaning that they hadn't fully earned their distribution as losses mounted late in that year.
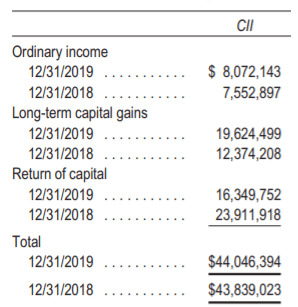
(Source - Annual Report)
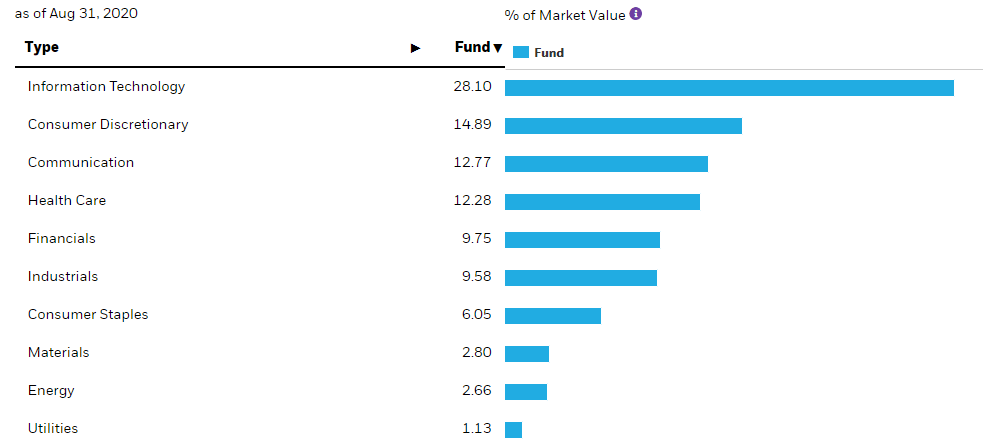
Holdings - Overweight Tech, But Not Solely Dependent On Tech
As we highlighted above, tech has helped this fund stave off some deep losses relative to some other areas of the market. However, CII isn't only a tech fund. They represent other sectors as well. The fund's turnover isn't anything too extreme; they last reported this at 30% for a 6-month reporting period. For 2019, turnover was 32% and in 2018, they reported a 27% turnover, though this is based on a lower number of holdings, last reported as having 57 positions.
(Source - Fund Website)
This more diversified approach can be appropriate for investors that want to consider a stronger tech position in their portfolio, but not diving right in with pure tech funds. Additionally, they target companies that are of considerable size and most definitely considered large-cap as the average market capitalization for their holdings is $452,501.8 million. Though this has averaged higher by a considerable factor when you have positions like Microsoft (MSFT), Apple (AAPL) and Alphabet (GOOG) (GOOGL). Some of the largest companies in the world, even before the significant rallies these names have experienced for months now.
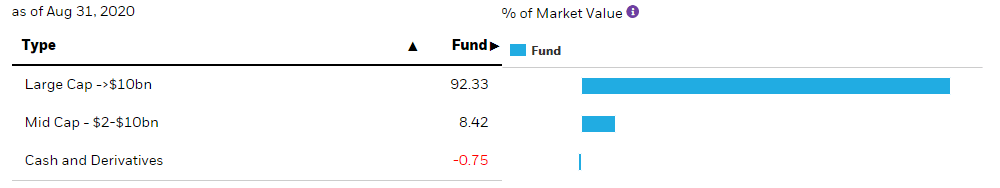
(Source - Fund Website)
The geography of the fund is also significantly comprised of U.S. positions at almost 90% of the portfolio. Though there is some small exposure to Europe and Asia. The geography, matched with the market cap and more diversified exposure are all areas that make this fund a bit more stable and less risky than others. That doesn't mean that it doesn't experience volatility, as we definitely see that it has, but that many of the names included in its portfolio will all but certainly be around for the foreseeable future.
(Source - Fund Website)
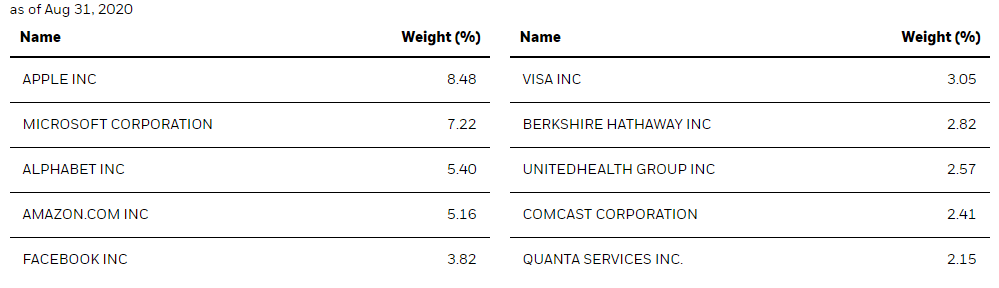
The fund only reported having 57 positions, as mentioned above. That does mean that its top 10 positions will generally tend to make up a large portion of the portfolio. The latest allocation accounts for 43.08% of the portfolio.
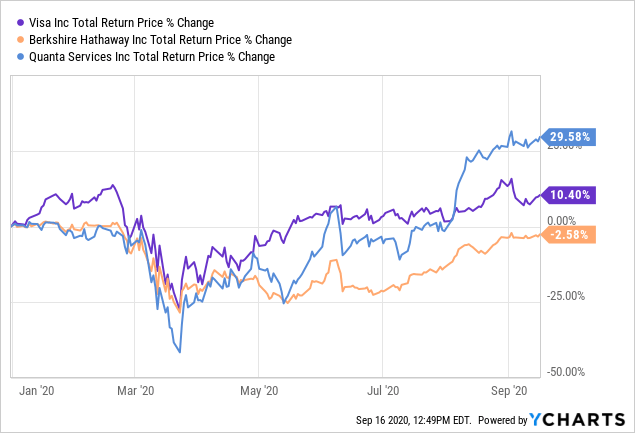
The large tech names, mentioned above, constitute the largest positions in the portfolio. Though there are a couple of more interesting positions worth noting. Visa (V) being a payment processing player means they have a tech focus too. This didn't help offer shelter from the negative effects of COVID-19. They reported Q3 earnings that showed falling revenue and EPS as payment volumes slipped. That wasn't anything unexpected as the pandemic was causing lockdowns. They also mentioned that "e-commerce, tap to pay, new flows, and value-added services" were helping to improve their month-to-month operations. The share price has rebounded significantly too.
Berkshire Hathaway Inc. (BRK.A) (BRK.B) being a conglomerate run by Warren Buffett provides some diversification in itself too. Though even the Oracle appears to not be immune to a pandemic as some business lines struggle.
Then there is Quanta Services, Inc. (PWR), which I haven't seen in other portfolios before. "Quanta engineers, constructs and maintains everything from generating stations, substations, transmission lines of any size and distribution lines." It is an industrial company that is a "leading specialty infrastructure solutions provider." They operate in both electric power and pipelines. They build infrastructure that provides the power we all use every day. They provide work for utility companies and telecoms too. These essential services have helped the stock price to 52-week highs.
Conclusion
CII provides a more diversified approach to tech, it isn't solely focused on tech though it is considerably overweight tech. The companies held in its underlying portfolio are rather large, this helps further stabilize the fund in companies that will be around going forward. That being said, it still provides some unique exposure to companies we don't always see in the top ten listings. PWR, being one of these positions that we don't typically see, yet are essential for our everyday lives - just as much as tech is!
Besides the overweight tech, the fund's significant discount, which has been reaching double digits, is rather enticing. The strong distribution then tops this off making it worth a "buy" at current levels. Though there might be those that prefer to remain more patient, holding off until volatility picks back up again. After all, tech did just experience a rather quick correction, and it isn't clear we are completely out of the woods yet.
Profitable CEF and ETF income and arbitrage ideas
 At the CEF/ETF Income Laboratory, we manage ~8%-yielding closed-end fund (CEF) and exchange-traded fund (ETF) portfolios to make income investing easy for you. Check out what our members have to say about our service.
To see all that our exclusive membership has to offer, sign up for a free trial by clicking on the button below!

Disclosure: I am/we are long CII, BDJ, MSFT. I wrote this article myself, and it expresses my own opinions. I am not receiving compensation for it (other than from Seeking Alpha). I have no business relationship with any company whose stock is mentioned in this article.
Additional disclosure: This article was originally published for members of the CEF/ETF Income Laboratory on September 17th, 2020.