
A Wealth Of Relative Value Opportunities In Preferred CEFs
Steadily lower CEF yields and heightened volatility have underlined the attraction of alpha-generation strategies. In this article, we take a look at a number of relative value CEF opportunities in the preferreds sector. Within the Flaherty & Crumrine suite of preferred CEFs, we highlight the Flaherty & Crumrine/Claymore Total Return Fund (FLC) over the Flaherty & Crumrine Dynamic Preferred and Income Fund (DFP) as well as the Flaherty & Crumrine Preferred Income Opportunity Fund (PFO) over the Flaherty & Crumrine Preferred Income Fund (PFD). Additional opportunities frequently crop up in the John Hancock as well as Nuveen CEFs.
A Relative Value Approach Recap
We described our relative value approach to CEFs in more detail in an earlier article. Here, we take a look at what's going on in the preferreds sector. This sector tends to be quite rich in relative value opportunities because it features a number of fund families each boasting a suite of very similar funds.
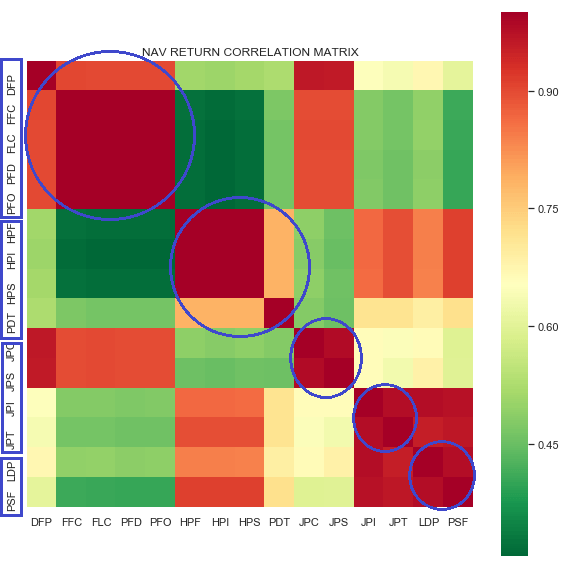
The chart below captures this dynamic, showing the NAV return correlation matrix of fund families with multiple funds. The redder the square, the higher the NAV return correlation between the two funds, and hence, the more alike the fund portfolios. The four fund families are highlighted on the y-axis of the correlation matrix. The circles show that these fund families tend to have funds that are quite similar to each other (i.e., funds within the same fund family tend to have red intersecting squares) and that are less similar to funds outside the family (i.e., funds across different fund families tend to have yellow or green intersecting squares).
This relationship is quite good, but it's not perfect. For example, the Nuveen fund family, in effect, splits their sector strategy into two groups. The two perpetual funds are quite close to each other and the two term funds are also close to each other, but the two fund sub-groups are somewhat but not very close to each other. In fact, the two term funds are closer to the two Cohen & Steers funds. What all this comes down to is that the presence of so many similar portfolios in the sector should lead to a sizable number of potential relative value permutations and opportunities.

Source: Systematic Income
Readers familiar with our approach know that the NAV correlation is one leg of a four-legged stool, with the other legs being NAV return differential, NII NAV yield differential and a stability in the discount spread between the funds in question. If all four of these factors are pointing in the right direction, then we have a sound analytical basis on which to act on the relative value signal.
Operationally, it is tricky to individually follow the several hundred of potential relative value pairs which is why we approach this by sorting through all the pairs on a daily basis and extracting what look to be the most promising pairs based on the fund similarity and valuation indicators. Both need to be flashing strong signals for an opportunity to be actionable.
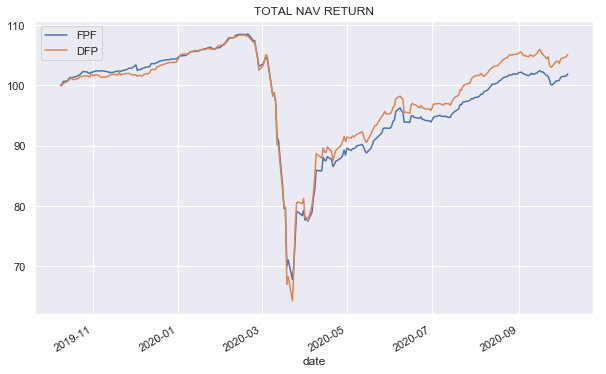
Finally, it's worth highlighting that pursuing relative value opportunities within a fund family is more straightforward than across fund families. For example, if we just look at the discount pattern of the First Trust Intermediate Duration Preferred & Income Fund (FPF) and DFP - two funds managed by different fund families - we may be immediately tempted to switch out of DFP into FPF given the recent discount divergence.

Source: Systematic Income
However, investors need to do a bit more work before pursuing these intra-fund sponsor opportunities. This is simply because of the different discretionary/fund policy decisions made by these funds which can fundamentally explain the technical divergence. For example, FPF has deleveraged during the drawdown earlier this year while DFP did not. This allowed DFP to bounce back quicker, outperforming FPF in the process. So, we can argue that the divergence in discounts simply reflects the more robust leverage profile of DFP or its stronger portfolio management approach, i.e., alpha. This doesn't necessarily mean that DFP is not trading at an expensive valuation or that this pair is not-tradeable; however, this kind of relative value opportunity requires a bit more analysis.
Source: Systematic Income
A final point worth keeping in mind is a fair-value level for CEF discounts. For funds within the same fund family which tend to boast similar leverage levels, and leverage costs, it will be driven by a divergence in fees. For example, as we discuss in the linked article, the three newer Flaherty CEFs should trade at slightly different discounts/premiums as they have different management fees. However, any short-term divergence is potentially tradable.
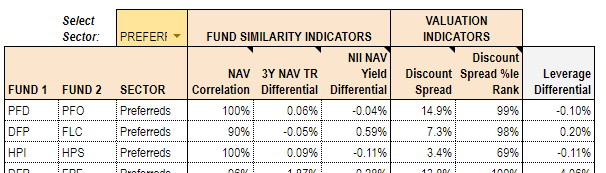
Below is a snapshot of the preferred sector's top potential opportunities at the time of writing.
Source: Systematic Income
John Hancock Funds
The four John Hancock funds in the sector are:
- John Hancock Premium Dividend Fund (PDT)
- John Hancock Preferred Income Fund (HPI)
- John Hancock Preferred Income Fund II (HPF)
- John Hancock Preferred Income Fund III (HPS)
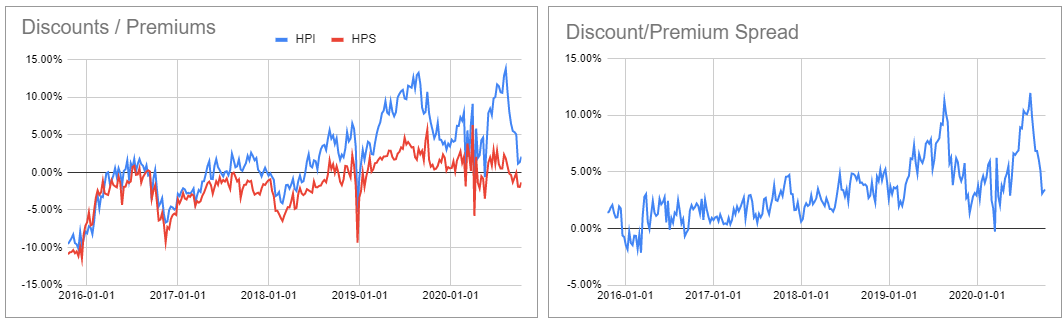
We discussed the recent dislocation of a John Hancock pair of CEFs in an August blog post when the divergence in the discounts of the two funds hit a double-digit level. Since then, the discount spread has collapsed to low single digits which is a historically fair-value level for this pair of funds.

Source: Systematic Income
A glance at HPI against HPS also shows that HPI was a sharp outlier.
Source: Systematic Income
Though the remaining opportunity here is fairly small, this pair bears watching.
Flaherty & Crumrine Funds
Flaherty & Crumrine manage 5 preferred CEFs:
- Flaherty & Crumrine Dynamic Preferred and Income Fund
- Flaherty & Crumrine Preferred and Income Securities Fund (FFC)
- Flaherty & Crumrine Total Return Fund
- Flaherty & Crumrine Preferred Income Fund
- Flaherty & Crumrine Preferred Income Opportunity Fund
The top relative value opportunity listed in the table above is the older pair of the Flaherty & Crumrine funds. This one is hard to explain. Not only does PFO (the lower premium fund) have a higher current yield but it also has slightly stronger 1-year and 10-year NAV returns. The two funds have a 99.98% NAV return correlation.
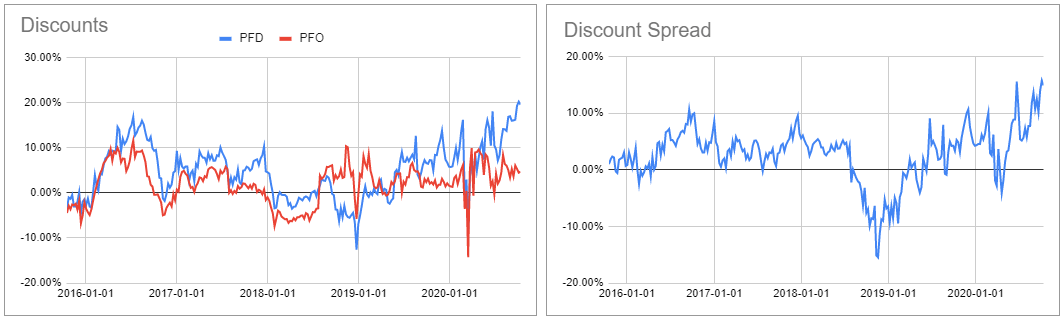
Source: Systematic Income
Another pair of Flaherty funds that looks interesting from a relative value perspective is DFP versus FLC and is the second row in the table above. Over the last few years, this pair has traded in relatively tight relationship. Given this pattern, FLC looks much more attractive at these levels.

Source: Systematic Income
Nuveen Funds
Nuveen has four funds in the sector:
- Nuveen Preferred & Income Opportunities Fund (JPC)
- Nuveen Preferred & Income Term Fund (JPI)
- Nuveen Preferred & Income Securities Fund (JPS)
- Nuveen Preferred and Income 2022 Term Fund (JPT)
As we suggested above, it makes sense to break up these four funds into the perpetual funds, JPC and JPS, and the term funds, JPT and JPI, based on their NAV return correlation profile. JPS appears to be trading slightly more expensive to its historical pattern versus JPC but nothing out of the ordinary.
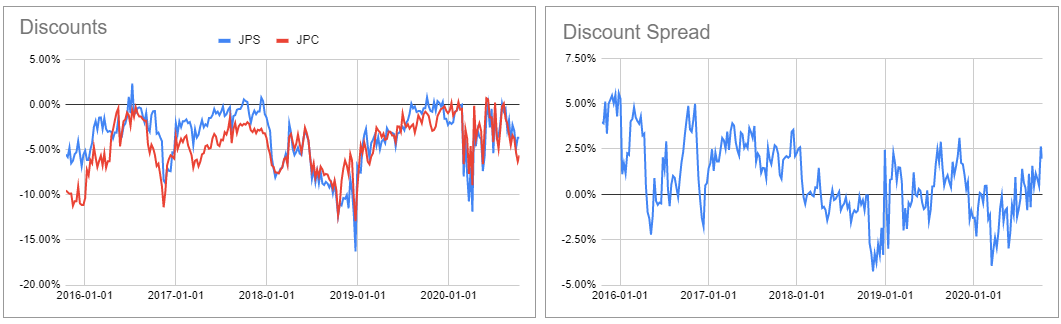
Source: Systematic Income
Given this pattern, FLC looks much more attractive at these levels.
The JPI and JPT pair adds an additional element into the relative value analysis - that of the pull-to-NAV yield. This is a metric which measures the additional per annum price return due to the yield compression towards zero on the fund's termination date. Whenever JPT discount exceeded that of JPI (highlighted in green in the right-hand chart below) it offered a very attractive opportunity to rotate into JPT.

Source: Systematic Income
Takeaways
Steadily lower CEF yields and elevated price volatility have underlined the attraction of pursuing relative value opportunities in the CEF space. The preferreds sector, in particular, offers a number of frequent rotation opportunities and offers a way to generate additional alpha for investors. This additional source of alpha offers an attractive diversifier and independent source of returns for income investors who are now facing a harder hill to climb after a strong recovery over the past six months.
Check out Systematic Income and explore our Income Portfolios, engineered with both yield and risk management considerations.
Use our powerful Interactive Investor Tools to navigate the closed-end fund, open-end fund, preferred and baby bond markets.
Read our Investor Guides: to CEFs, Preferreds and PIMCO CEFs.
Check us out on a no-risk basis - sign up for a 2-week free trial!

Disclosure: I am/we are long JPI, JPT. I wrote this article myself, and it expresses my own opinions. I am not receiving compensation for it (other than from Seeking Alpha). I have no business relationship with any company whose stock is mentioned in this article.