
5 Best CEFs To Buy This Month (October 2020)
The market had lost some of its mojo in September but has regained ground since the start of this month. The S&P 500 is attempting to make new all-time highs once again. So, what's leading this fresh momentum? It's probably a combination of many positive factors, for example, the renewed hope of a fresh round for a stimulus package, continued economic recovery, some positive news on COVID-19 in terms of the effectiveness of new treatments and therapeutics, and progress on the development of vaccines. Also, it appears that the market is signaling a clear victory, whether it goes in favor of President Trump or former Vice President Biden, which is hard to tell.
Sure, the market is not out of the woods yet. There are plenty of challenges and worries that are keeping a lot of people on the sidelines. The very same factors that seem to act as positive catalysts also are causing the uncertainties in investors' minds, for instance, the rise of coronavirus cases in Europe and possibly in the US as the winter arrives, continued failure on the part of Republicans and Democrats to reach an agreement on the size and scope of the stimulus bill, and all the uncertainties that are still surrounding the upcoming US presidential election.
All that said, the picture is never crystal clear, even in the best of times. If it were so, there would be no value left to be found in the market as everything would be priced to perfection. So, it's always prudent to ignore the short-term gyrations of the market and focus on the long term. In that spirit, we keep looking for good investment opportunities and keep our wish list ready and buy when the time is right.
Why Invest in CEFs?
For income investors, closed-end funds remain an attractive investment class that offers high income (generally in the range of 6%-10%, often 8% plus), broad diversification (in terms of variety of asset classes), and market matching total returns in the long term if selected carefully and acquired at reasonable price points. A $500K CEF portfolio can generate nearly $40,000 a year, compared to a paltry under $10,000 from S&P 500. Now, if you were a retiree and needed to use all of that income, the portfolio would not grow much, but it may still grow enough to beat the rate of inflation. That certainly beats investment vehicles like annuities. Ideally, if you have a large enough pool of retirement funds, there's generally no need to put more than 20% into CEFs, but these are decisions that can only be made on a personal level based on individual situations.
However, it's important to be aware of the risks and challenges that come with investing in CEFs. We list various risk factors at the end of this article. They are not suitable for everyone, so please consider your goals, income needs, and risk tolerance carefully before you invest in CEFs.
Closed-end funds, in general, had performed very well in the last year, until the coronavirus meltdown. The coronavirus pandemic and the resulting economic shutdown have had real and serious impacts on many sectors and industries. CEFs had taken a serious beating, and their recovery has been weaker than the broader market. That's why many of them are still offering attractive discounts to their NAVs. So, is now the time to buy? Probably yes, albeit in small lots. No one can predict with any certainty the future direction of the market. So we continue to be on the lookout for good investment candidates that have a solid track record, offer good yields, and are offering great discounts.
5 Best CEFs to Consider Every Month
This series of articles attempts to separate the wheat from the chaff by applying a broad-based screening process to the 500 CEF funds, followed by an eight-criteria weighting system. In the end, we are presented with about 30-40 of the most attractive funds in order to select the best five. However, please note that we do not consider funds that have a history of fewer than five years.
This is our regular series on CEFs where we highlight five CEFs that are relatively cheap, offer "excess" discounts to their NAVs, pay reasonably high distributions, and have a solid track record. We also write a monthly series to identify "5 Safe and Cheap DGI" stocks. You can read our most recent such article here.
We use our multi-step filtering process to select just five CEFs from around 500 available funds.
The selected five CEFs this month, as a group, are offering an average distribution rate of 7.81% (as of 10/09/2020) and a discount and excess discount (compared to 52-week average) of -8.13% and -3.78%, respectively. Besides, these five funds have collectively returned 12.22% and 12.19% in the last three and five years. Since this is a monthly series, there may be some selections that could overlap from month to month.
Please note that these are not recommendations to buy but should be considered as a starting point for further research.
Author's Note: This article is part of our monthly series that tries to discover five best buys in the CEF arena at that point in time. Certain parts of the introduction, definitions, and the section describing selection criteria/process may have some commonality and repetitiveness with our other articles in the series. This is unavoidable as well as intentional to keep the entire series consistent and easy to follow for the new readers. Regular readers who follow the series from month to month could skip the general introduction and sections describing the selection process.
Goals for the Selection Process
Our goals are simple and are aligned with most conservative income investors, including retirees who wish to dabble in CEFs. We want to shortlist five closed-end funds that are relatively cheap, offering good discounts to their NAVs, paying relatively high distributions, and have a solid and substantial past track record in maintaining and growing their NAVs. Please note that we are not necessarily going for the cheapest funds (in terms of discounts or highest yields), but we also require our funds to stand out qualitatively. We adopt a systematic approach to filter down the 500-plus funds into a small subset.
Here's a summary of our primary goals:
- High income/distributions.
- Reasonable long-term performance in terms of total return on NAV: We also try to measure if there has been an excess NAV return over and above the distribution rate.
- Cheaper valuation at the time of buy determined by the absolute discount to NAV and the "excess" discount offered compared to their history.
- Coverage ratio: We try to measure to what extent the income generated by the fund covers the distribution. Not all CEFs fully cover the distribution, especially the equity, and specialty funds, as they depend on the capital gains to cover their distributions. We adjust this weight according to the type and nature of the fund.
We believe that a well-diversified CEF portfolio should at least consist of 10 CEFs or more, preferably from different asset classes. It's also advisable to build the portfolio over a period rather than invest in one lump sum. If you were to invest in one CEF every month, in a year, you would have a well-diversified CEF portfolio. What we provide here every month is a list of five probable candidates for further research. We think a CEF portfolio can be an important component in the overall portfolio strategy. One should preferably have a DGI portfolio as the foundation, and the CEF portfolio could be used to boost the income level to the desired level. How much should one allocate to CEFs? Each investor needs to answer this question himself/herself based on the personal situation and factors like the size of the portfolio, income needs, risk appetite, or risk tolerance.
Selection Process
We have more than 500 CEF funds to choose from, which come from different asset classes like equity, preferred stocks, mortgage bonds, government and corporate bonds, energy MLPs, utilities, infrastructure, and municipal income. Just like in other life situations, even though the broader choice always is good, it does make it more difficult to make a final selection. The first thing we want to do is to shorten this list of 500 CEFs to a more manageable subset of around 75-100 funds. We can apply some criteria to shorten our list, but the criteria need to be broad and loose enough at this stage to keep all the potentially good candidates. Also, the criteria that we build should revolve around our original goals. We also demand at least a five-year history for the funds that we consider. However, we do take into account the 10-year history, if available.
Criteria to Shortlist:
Criteria | Brings down the number of funds to... | Reason for the Criteria |
Baseline expense < 2.5% and Avg. Daily Volume > 10,000 | Approx. 435 Funds | We do not want funds that charge excessive fees. Also, we want funds that have fair liquidity. |
Market-capitalization > 100 Million | Approx. 400 Funds | We do not want funds that are too small. |
Track record/ History longer than five years (inception date 2015 or earlier) | Approx. 375 Funds | We want funds that have a reasonably long track record. |
Discount/Premium < +6% | Approx. 350 Funds | We do not want to pay too high a premium; in fact, we want bigger discounts. |
Distribution (dividend) Rate > 5% | Approx. 260-275 Funds | The current distribution (income) to be reasonably high. |
| 5-Year Annualized Return on NAV > 0% AND 3-Year Annualized Return on NAV >0% | Approx. 200 – 220 Funds | We want funds that have a reasonably good past track record in maintaining their NAVs. |
After we applied the above criteria this month, we were left with 222 funds on our list. But it's too long a list to present here or meaningfully select five funds.
Note: Most of the data in this article is sourced from Cefconnect.com, Cefa.com, and Morningstar.com.
Narrowing Down to 50-60 Funds
To bring down the number of funds to a more manageable number, we will shortlist 10 funds based on each of the following criteria. After that, we will apply certain qualitative criteria to each fund and rank them to select the top five.
Six broad criteria:
- Excess discount/premium (explained below).
- Distribution rate.
- Return on NAV, last three years (medium-term).
- Return on NAV, last five years (long term).
- Coverage ratio.
- Excess return over distributions.
- The total weight (calculated up to this point).
Excess Discount/Premium:
We certainly like funds that are offering large discounts (not premiums) to their NAVs. But sometimes, we may consider paying near zero or a small premium if the fund is great otherwise. So, what's important is to see the "excess discount/premium" and may not be the absolute value. We want to see the discount (or premium) on a relative basis to their record, say 52-week average.
Subtracting the 52-week average discount/premium from the current discount/premium will give us the excess discount/premium. For example, if the fund has the current discount of -5%, but the 52-week average was +1.5% (premium), the excess discount/premium would be -6.5%.
Excess Discount/Premium = Current Discount/Premium (Minus) 52-Wk Avg. Discount/ Premium
So, what's the difference between the 12-month Z-score and this measurement of Excess Discount/Premium? The two measurements are quite similar, maybe with a subtle difference. The 12-month Z-score would indicate how expensive (or cheap) the CEF is in comparison to the 12 months. Z-score also takes into account the standard deviation of the discount/premium. Our measurement (excess discount/premium) compares the current valuation with the last 12-month average.
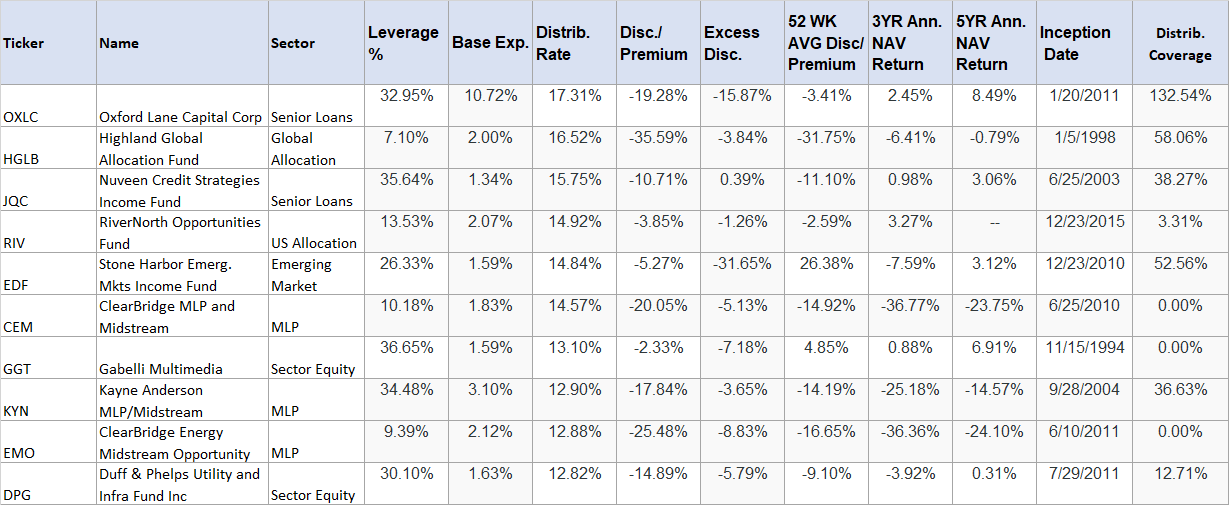
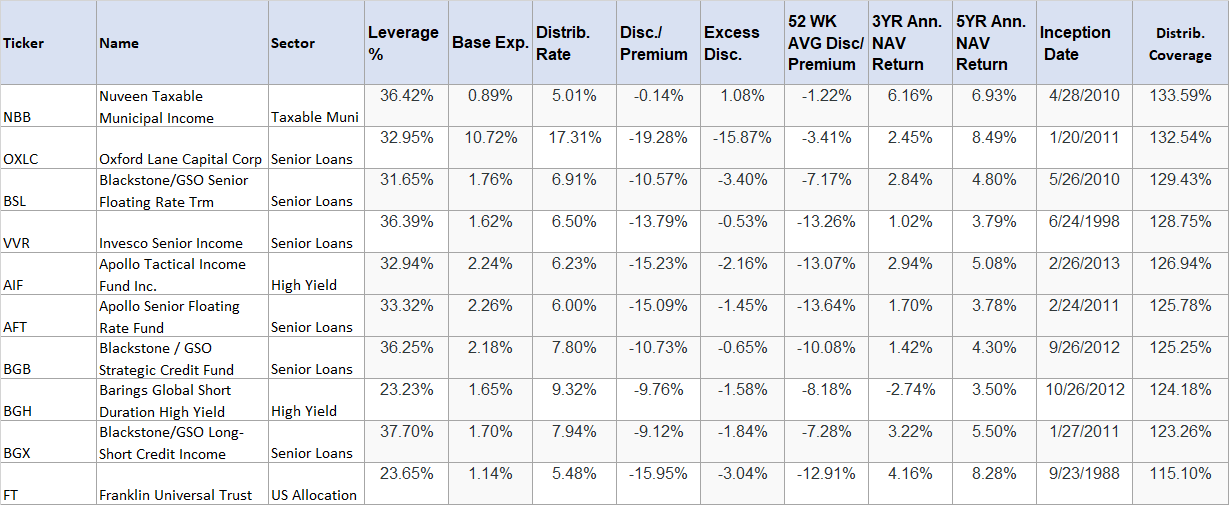
We sort our list (of 222 funds) on the "excess discount/premium" in descending order. For this criterion, the lower the value, the better it is. So, we select the top 10 funds (most negative values) from this sorted list.
(All data as of 10/09/2020)
High Current Distribution Rate:
After all, most investors invest in CEF funds for their juicy distributions. We sort our list (of 222 funds) on the current distribution rate (descending order, highest at the top) and select the top 10 funds from this sorted list.
Medium Term Return on NAV (last three years):
We then sort our list (of 222 funds) on a three-year return on NAV (on descending order, highest at the top) and select the top 10 funds.
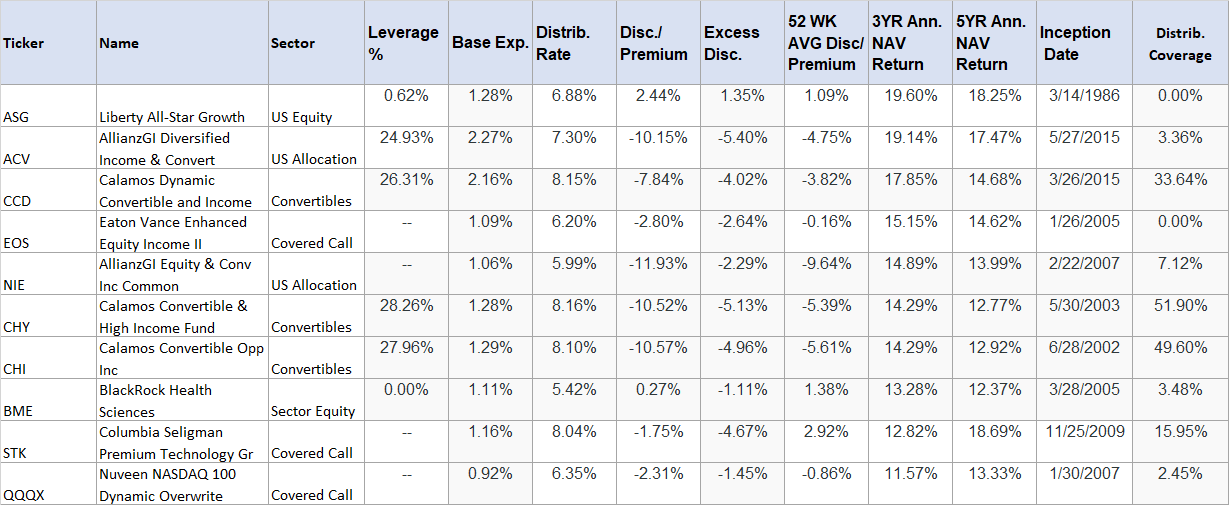
Five-Year Annualized Return on NAV:
We then sort our list (of 222 funds) on the five-year return on NAV (on descending order, highest at the top) and select the top 10 funds.
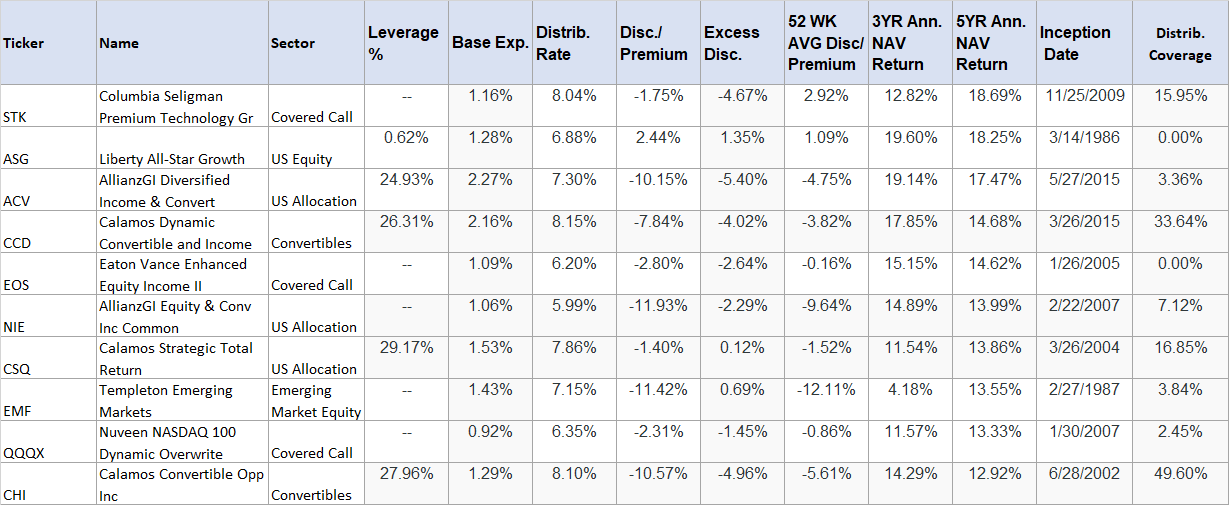
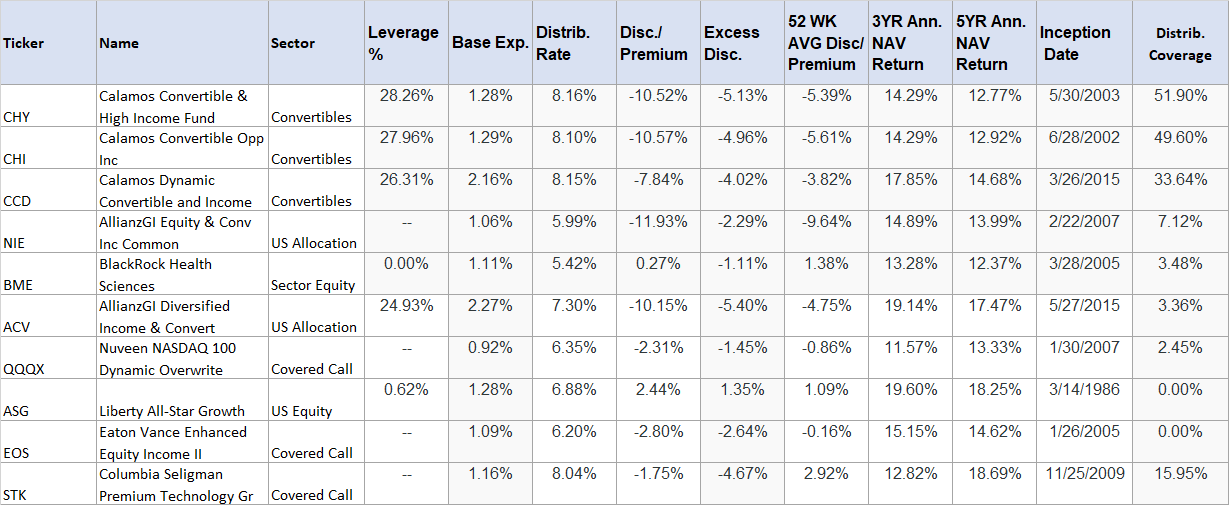
Coverage Ratio (Distributions vs. Earnings):
We then sort our list (of 222 funds) on the coverage ratio and select the top 10 funds. The coverage ratio is derived by dividing the earnings per share by the distribution amount for a specific period. Please note that in some cases, the coverage ratio may not be very accurate since the "earnings per share" maybe three to six months old. But in most cases, it's fairly accurate.
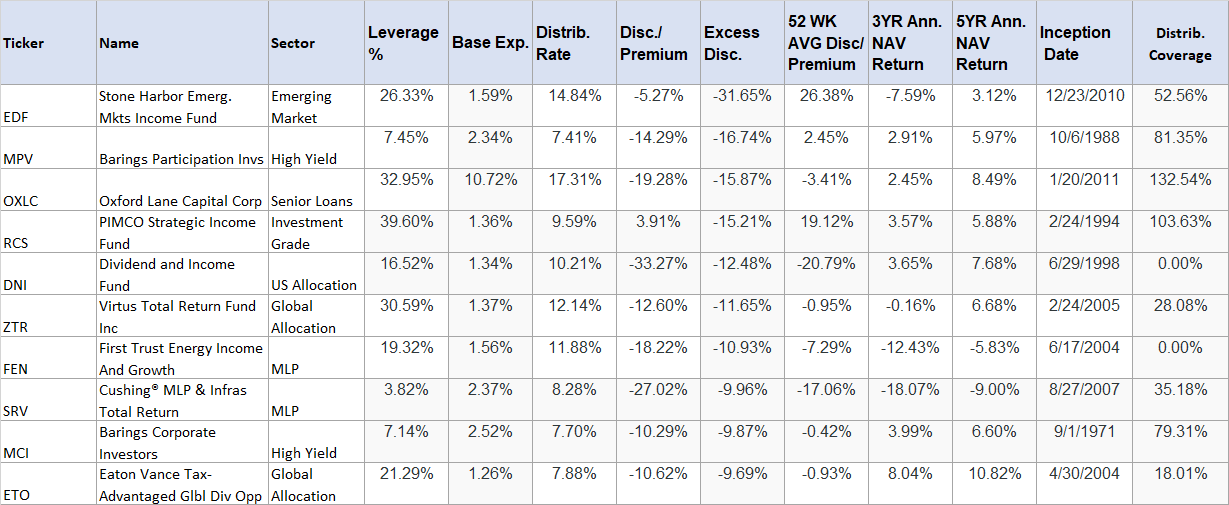
Excess Return Over Distribution:
This is the "excess return" provided by the fund over the distribution rate. It's calculated by subtracting the distribution rate from the three-year NAV return.
Total Weight (Quality Score) calculated up to this point:
Note: The Total Weight calculation is not fully completed at this point since we have not taken into account the 10-year NAV return. Also, we would adjust the weight for the coverage ratio at a later stage. However, we select the top 15 names on this basis (instead of 10 for other criteria).
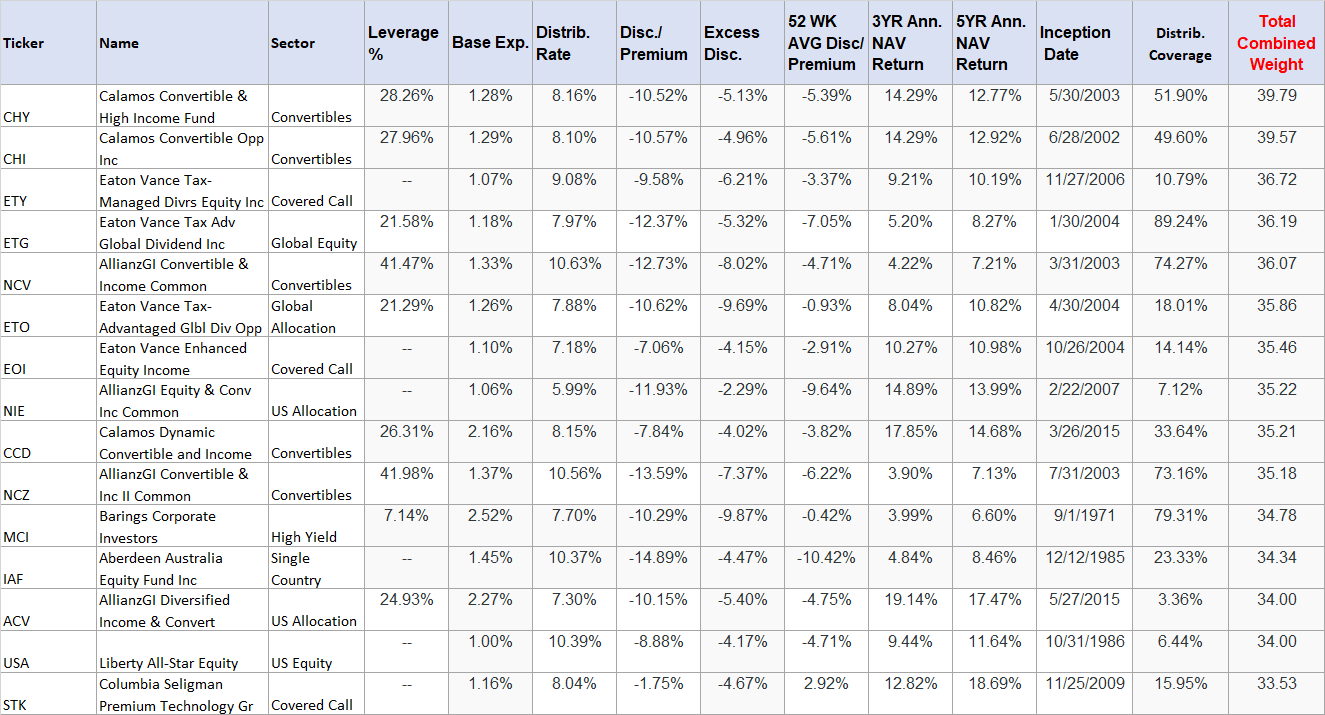
Now we have 75 funds in total from the above selections. We will see if there are any duplicates. In our current list of 75 funds, there were 29 duplicates, meaning there are funds that appeared more than once. The following names appear twice (or more):
Appeared two times: BME, EDF, ETO, MCI
Appeared three times: ASG, CHY, EOS, OXLC, QQQX
Appeared four times: ACV, CCD, CHI, NIE, STK
So, once we remove 29 duplicate rows, we are left with 46 funds.
We also remove funds that have both 3-YR and 5-YR NAV returns as negative. This removes HGLB, SRV, FEN, KYN, EMO, and CEM. We are now left with 40 funds.
Note: It may be worthwhile to mention here that just because a fund has appeared multiple times does not necessarily make it an attractive candidate. Sometimes, a fund may appear multiple times simply for wrong reasons, like a high current discount, high excess discount, or a very high distribution rate that may not be sustainable. But during the second stage of filtering, it may not score well on the overall quality-score due to other factors like poor track record. That said, if a fund has appeared four times, it may be worth a second look.
Narrowing Down to Just 10-12 Funds
In our list of funds, we already may have some of the best probable candidates. However, so far, they have been selected based on one single criterion that each of them may be good at. That's not nearly enough. So, we will apply a combination of criteria by applying weights to eight factors to calculate the total quality score and filter out the best ones.
We will apply weights to each of the eight criteria:
- Baseline expense (Max weight 5)
- Current distribution rate (Max weight 10)
- Excess discount/premium (Max weight 5)
- 3-YR NAV return (Max weight 5)
- 5-YR NAV return (Max weight 5)
- 10-YR NAV return (Max weight 5, if less than ten years history, an average of 3-yr & 5yr)
- Excess NAV return over distribution rate (Max weight 5)
- Adjusted Coverage Ratio (Max weight 10): This weight is adjusted based on the type of fund to provide fair treatment to certain types like equity and sector funds. We assign some bonus points to certain types of funds, which by their make-up, depend on capital gains to fund their distributions, to bring them at par with fixed-income funds. These fund types include Equity/ Sector equity (four bonus points), real estate (three points), covered call (two points), and MLP funds (variable). However, please note that this is just one of nine criteria that are being used to calculate the total quality score.
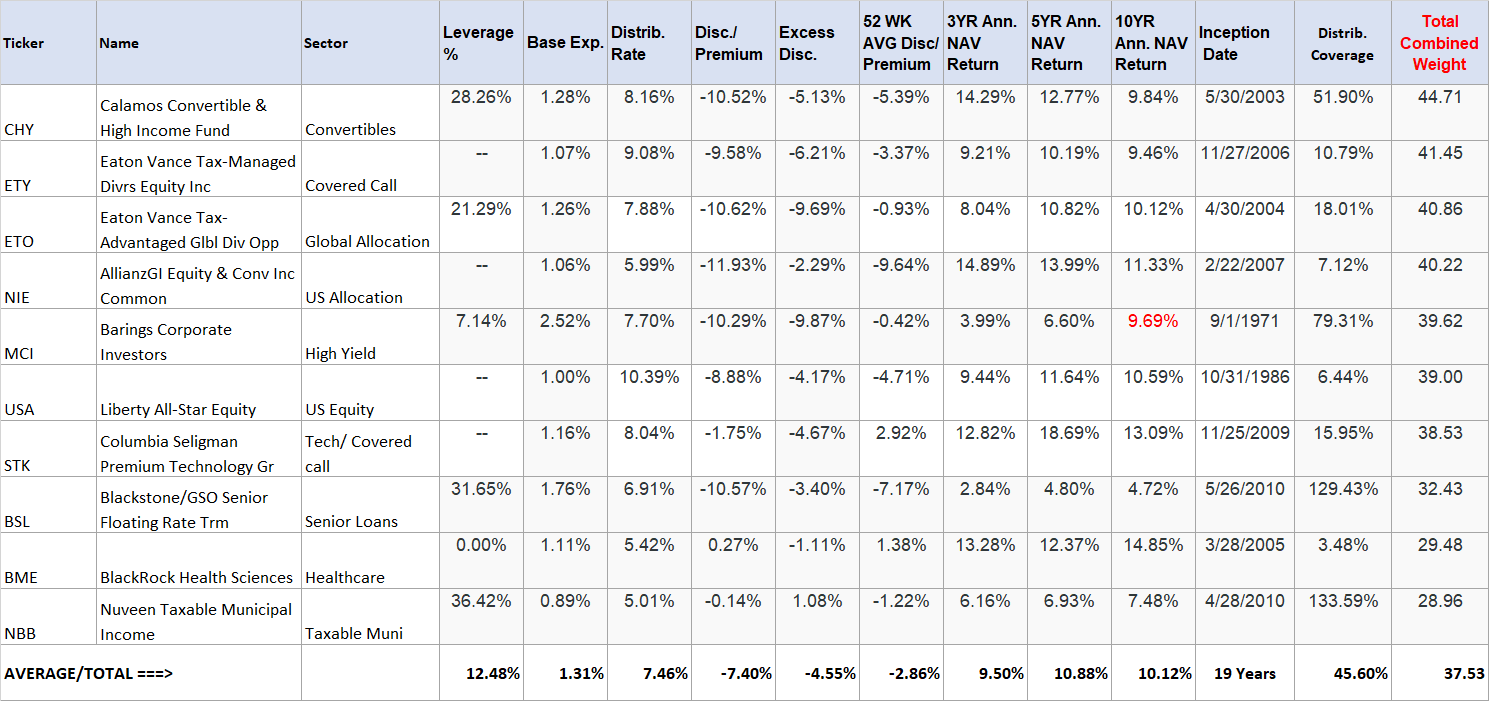
Once we have calculated the weights, we combine them to calculate "Total Combined Weight," also called the "Quality Score." The sorted list (spreadsheet) of 40 funds on the "combined total weight" is attached here.
5_Best_CEFs_To_Buy_-_Oct_2020_-_for_Export.xlsx
The top 25 funds (out of 40) are also listed below:
(CHY), (CHI), (ETY), (ETG), (ETO), (EOI), (NIE), (NCV), (MCI),
(USA), (NCZ), (CCD), (STK), (ACV), (EOS), (IAF), (FT), (MPV),
(QQQX), (BME), (ZTR), (BSL), (ASG), (DNI), (GGT).
In order to structure a CEF portfolio, it's highly recommended to diversify in funds that invest in different types of asset classes. In our list of 40, if we were to look at first on the basis of asset-type (sector) and then based on the total quality score/weight, below is the list of top funds. Please note that some asset classes may not make it to the top 25 due to the fact that these ratings are dynamic and time-sensitive and change from month to month.

If you were to select 10 picks, we would simply pick the top one from each of the above categories. That said, due diligence on each name is still recommended. Please note that some of them have cut their distributions recently, and for some folks, that may be a good enough reason to not consider them.
Here is the list of top 10:
Final Selection: Our List of Final Top 5
Now, if we had only five slots for investment and need to select just five funds, we will need to make some subjective selections. However, we should be careful to select from different sectors (or asset classes). Since this step is mostly subjective, it will differ from person to person. Here are the selections for this month, based on our perspective:
Some information about the selections:
- USA and BME are our equity funds this month, BME being the healthcare-sector fund. Neither of these funds uses leverage. USA fund did reduce the dividend slightly in the month of August, but then it increased it back slightly for September month. BME is the health sciences fund and has an excellent track record. However, BME commands a slight premium, and the distribution rate is relatively low.
- CHY is invested 55% in convertible securities, 30% in bonds, and the rest in preferred and other securities. This fund from the Calamos family of funds has an excellent track record and reasonably high distributions.
- Among other funds in our top-10, ETO, MCI, and BSL have reduced their distributions varying from 15% to 25%.
- None of the real-estate or MPL funds could make it to our top 10 or top five list this month.

CEFs Specific Investment Risks
It goes without saying that CEFs, in general, have some additional risks. This section is specifically relevant for investors who are new to CEF investing, but in general, all CEF investors should be aware of.
- Leverage and high fees:
They generally use some amount of leverage, which adds to the risk. The leverage can be hugely beneficial in good times but can be detrimental during tough times. The leverage also causes higher fees because of the interest expense in addition to the baseline expense. In the tables above, we have used the baseline expense only. If a fund is using significant leverage, we want to make sure that the leverage is used effectively by the management team - the best way to know this is to look at the long-term returns on the NAV. NAV is the "net asset value" of the fund after counting all expenses and after paying the distributions. So, if a fund is paying high distributions and maintaining or growing its NAV over time, it should bode well for its investors.
- Volatility:
Due to leverage, the market prices of CEFs can be more volatile as they can go from premium pricing to discount pricing (and vice versa) in a relatively short period. Especially during corrections, the market prices can drop much faster than the NAV (the underlying assets). Investors who do not have an appetite for higher volatility should generally stay away from CEFs or at least avoid the leveraged CEFs.
- Premium over NAVs:
CEFs have market prices that are different from their NAVs (net asset values). They can trade either at discounts or at premiums to their NAVs. Generally, we should stay away from paying any significant premiums over the NAV prices unless there are some very compelling reasons.
- Asset-specific risk:
Another risk factor may come from asset concentration risk. Many funds may hold similar underlying assets. However, this is easy to mitigate by diversifying into different types of CEFs ranging from equity, equity covered calls, preferred stocks, mortgage bonds, government and corporate bonds, energy MLPs, utilities, and municipal income.
Concluding Thoughts
The underlying purpose of this exercise is to highlight five likely best funds for investment each month using our screening process. As always, our filtering process demands that our selections have a solid long-term record, maintain good earnings to distribution coverage (in certain categories), offer reasonably high distributions, and are cheaper on a relative basis, and offer a reasonable discount. Also, we ensure that the selected five funds are from a diverse group in terms of the types of assets. Please note that these selections are based on our rating system and dynamic in nature. So they can change from month-to-month (or even week-to-week). At the same time, some of the funds can repeat from month-to-month if they remain attractive over an extended period.
This month, some of the selected CEFs are more conservative compared to the previous month, and that's causing the overall yield to drop a bit. The selected five CEFs this month, as a group, are offering an average distribution rate of 7.81% (as of 10/09/2020) and a discount and excess discount (compared to 52-week average) of -8.13% and -3.78%, respectively. Besides, these five funds have collectively returned 12.22%, 12.19%, and 11.21% in the last three, five, and 10 years. Most CEFs are likely to remain a bit volatile for the next few months until the economy finally turns around. It's probably a good opportunity to lock in the high yield, though there may still be some pain ahead. So, it's always good to be cautious and conservative and should add in small and multiple lots to take advantage of dollar-cost averaging.
We believe that the above group of CEFs makes a great watch list for further research.

High Income DIY Portfolios: The primary goal of our "High Income DIY Portfolios" Marketplace service is high income with low risk and preservation of capital. It provides DIY investors with vital information and portfolio/asset allocation strategies to help create stable, long-term passive income with sustainable yields. We believe it's appropriate for income-seeking investors including retirees or near-retirees. We provide six portfolios: two High-Income portfolios, a DGI portfolio, a conservative strategy for 401K accounts, a Sector-Rotation strategy, and a High-Growth portfolio. For more details or a two-week free trial, please click here.
Disclosure: I am/we are long ABT, ABBV, JNJ, PFE, NVS, NVO, UNH, CL, CLX, GIS, UL, NSRGY, PG, KHC, ADM, MO, PM, BUD, KO, PEP, D, DEA, DEO, ENB, MCD, BAC, PRU, UPS, WMT, WBA, CVS, LOW, AAPL, IBM, CSCO, MSFT, INTC, T, VZ, VOD, CVX, XOM, VLO, ABB, ITW, MMM, LMT, LYB, ARCC, AWF, CHI, DNP, EVT, FFC, GOF, HCP, HQH, HTA, IIF, JPC, JPS, JRI, KYN, MAIN, NBB, NLY, NNN, O, OHI, PCI, PDI, PFF, RFI, RNP, STAG, STK, UTF, TLT. I wrote this article myself, and it expresses my own opinions. I am not receiving compensation for it (other than from Seeking Alpha). I have no business relationship with any company whose stock is mentioned in this article.
Additional disclosure: Disclaimer: The information presented in this article is for informational purposes only and in no way should be construed as financial advice or recommendation to buy or sell any stock. The author is not a financial advisor. Please always do further research and do your own due diligence before making any investments. Every effort has been made to present the data/information accurately; however, the author does not claim 100% accuracy. The stock portfolios presented here are model portfolios for demonstration purposes.