4 Funds Bought In August, Mixture Of Opportunity And Speculation
Written by Nick Ackerman, co-produced by Stanford Chemist
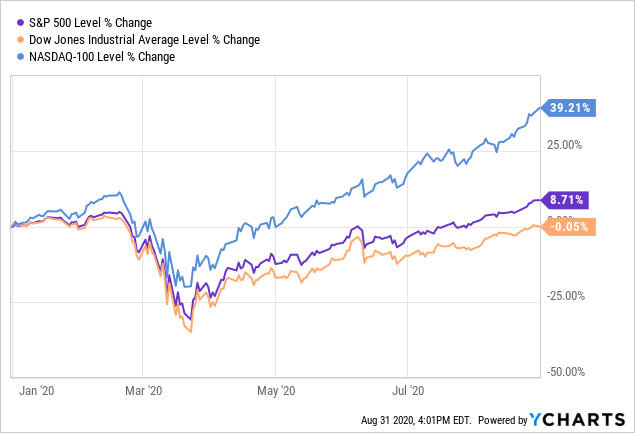
August was once again a month of rebounding from the lows reached in March of this year. This marks five straight months of gains for the broader indexes. The three major indexes are now all positive for the year, with the Dow Jones Industrial Average Index (DJI) hitting positive for the year, before heading ever so slightly lower. The S&P 500 Index (SP500) making all-time highs - joining the Nasdaq 100 Index (NDX) that has been on fire hitting all-time highs.

Another month marked by tech still leading the way higher, followed by communication services. Bringing up near the rear was energy. However, this time, utilities played the bottom performing sector. This was the strongest August since 1984 for both the SP500 and DJI.
Utilities are traditionally a stable area of the market. Though this year they are still stuck in negative territory. Heading into 2020, utilities were rather stretched in valuation, and that is one potential reason for the lagging performance. They weren't spared from March's sell-off either. The rebound has been tepid though, as utilities are definitely not in momentum's favor.
To explain this, we can take a look at the top-performing sectors. This includes technology, consumer discretionary and communication services. We measure their performance via the Technology Select Sector SPDR ETF (XLK), Consumer Discretionary Select Sector SPDR ETF (XLY) and Communication Services Select Sector SPDR Fund (XLC). As seen below, these funds are all doing exceptionally well on a YTD basis.
(Source: Seeking Alpha)
The rest of the market sectors are more akin to what is happening in the broader economy. That is seeing some areas of strength, but several areas of weakness as well. Energy and financials, for example, are two cyclical sectors and they are down significantly.
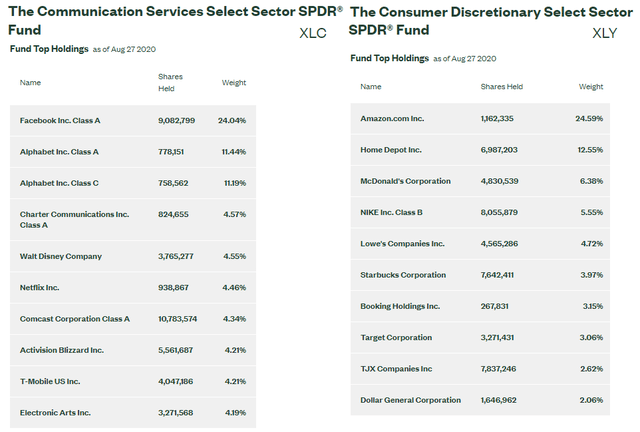
The three leading sectors have one thing in common too, they hold big tech names in their top positions. That is even though XLC and XLY are different sectors, they still put in the same names. That is reflecting the true nature of some of the largest tech names these days; we don't know where to classify them as they span across different categories. In XLY's case, Amazon (AMZN) is the top position, followed by Home Depot (HD) - another stock benefitting tremendously this year.
(Source - Funds' Websites)
XLC holds several tech names in high concentrations. The same problem with XLY, the top two make up over 37% of their portfolio. This is in names that have been doing very well this year - thus, disproportionately making it seem like a larger portion of the market is doing well.
With that in mind, August was another month where I didn't go diving in buying with both hands. As markets hit all-time highs or trade near them, I generally like to keep a healthy amount of cash accumulated and on hand.
Some of the funds I cover are a review, as I covered the funds more extensively earlier in the month. I tend to review funds that I find interesting - then end up buying several days after covering the funds.
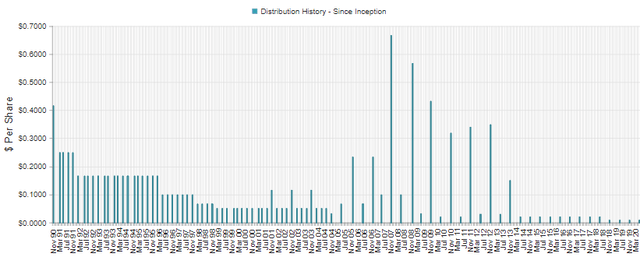
While we have to be more selective as we roll higher, there are always some opportunities somewhere. If anything, a little bit of buying still increases an investor's annual income if they're buying dividend-producing investments. This can also be a good strategy to mitigate potential future cuts as well. As most CEF investors know, distributions tend to go down over time and not increase. That is the trade-off for higher yields up-front! Though distribution cuts aren't necessarily a reason to sell a fund either.
I like to start accumulating a cash nest egg when we get near highs and then put those funds to work on pullbacks, corrections and even bear markets. During bear markets, I'm usually throwing every cent in that I can. Thanks to $0 commissions, this latest downturn actually meant it was cheaper to do this!
They will be listed as I bought them for the month. The first will be near the beginning of the month, and the last listed will be ones I purchased later in the month.
(Source: Getty Images)
Kayne Anderson Midstream Energy Fund, Inc. (KMF)
This fund will be changing its name to Kayne Anderson NextGen Energy Infrastructure Inc. It will be putting a focus on investing in utilities and infrastructure with a renewable tilt. That should position the fund for a couple of benefits; broaden out its investment portfolio to include assets outside of energy and benefit from the momentum that ESG investing is having in the energy space. In fact, they have already started this transition.
I actually made two additional purchases this month. The first was when I sold the other Kayne Anderson fund I held; the Kayne Anderson MLP/Midstream Investment Company (KYN).
While KYN is also changing its name and investment policy, KMF is making the transition more aggressively. KYN wrote this in their FAQ; "while midstream will likely continue to represent a majority of the Company's investments for the foreseeable future, KYN plans to meaningfully increase its portfolio allocations to renewable infrastructure companies and utilities over the next few years."
KYN has allocated 10% currently to "renewables," with KMF at 38% categorized as "renewable infrastructure/utilities." For me, it was time to lock in losses in KYN and simplify my portfolio a bit. As I hold Cushing NextGen Infrastructure Income Fund (SZC) as well. Though I do believe the case can be made for someone holding all three as they are sufficiently varying.
The second purchase was later in the month. I sold out of my position in Macquarie Global Infrastructure Total Return Fund Inc (MGU). I still believe that MGU has merit in an investor's portfolio. Again though, for my personal situation, it was another good candidate for locking in some losses and consolidating my portfolio. I hold several utility/infrastructure funds. MGU's low distribution should also be a trade-off for potentially greater growth in the fund going forward.
KMF has around $425 million in total managed assets. The fund utilizes leverage through a credit facility and through preferred stock. The preferred stock is a rather expensive form of leverage. Though some of the highest issued is maturing in 2021. As interest rates aren't expected to rise, newer issues offered should cut the dividend they have to offer on potential future issuances. With that being said, they still charge some high management fees and that should be noted. The expense ratio, without leverage costs, still comes to 2.3%.
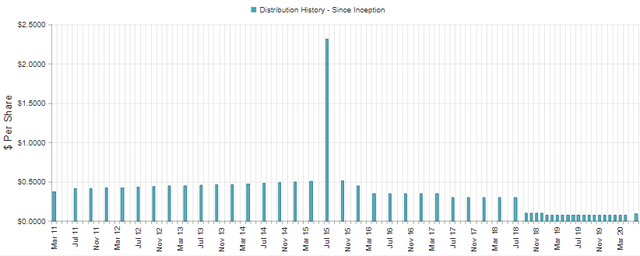
KMF did also cut its distribution earlier this year. It went from a monthly $0.075 to now a quarterly $0.09. Which is quite a cut, but was necessary as the portfolio was all energy earlier this year.
(Source - CEFConnect)
Oxford Lane Capital (OXLC)
As OXLC is still significantly underwater from my original basis, I continued to average down. As a fund in the equity CLO space, it is extremely volatile and only for investors that can withstand higher risks. The bright spot this month, along with an increasing NAV, was that the distribution was announced through the rest of 2020.
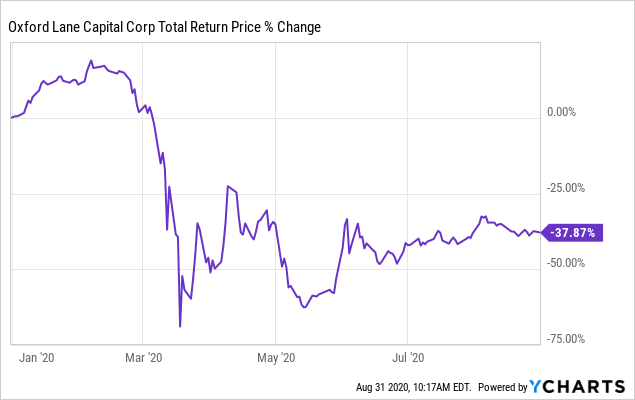
The fund, along with the other CLO funds, fell especially hard in March along with the market. It has come back from the lows that it reached but has lost a significant amount regardless. The NAV isn't updated daily, but they have been providing monthly updates recently and this has been showing a rebound in the underlying assets. Their last report showed NAV around $3.25 to $3.35 per share.
Stanford Chemist provides a convenient table I'll share below to compare all the CLO funds. The model for OXLC is tied closely to what ECC has been reporting for NAV. As level 3 assets both funds use a different model to price these illiquid investments.
| ECC | OXLC (Official) | OXLC (model) | OCCI | EIC | |
| 7/31 NAV | $7.87 | $3.30 | $5.06 | $10.66 | $14.30 |
| Current Price | $7.79 | $4.24 | $4.24 | $10.78 | $13.02 |
| Current premium/discount | -0.01% | 28.48% | -16.20% | 0.01% | -8.95% |
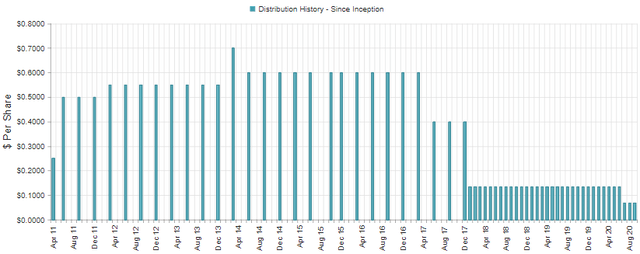
The primary draw for a CLO fund is the extremely high distribution rate. Of course, the drop in share price has erased any positive total returns. The distribution cuts were another catalyst that sent investors towards the exits. Even after those cuts, the fund is still showing a distribution rate of 19.06%.
(Source - CEFConnect)
BrandywineGLOBAL Global Income Opportunities Fund (BWG)
This was on a play for their planned tender offer. While that was a factor in purchasing the shares, for me, the fund also has to be a potential long-term hold. This is for the simple fact that the tender offer might not end up making sense if the market collapses - i.e. if the NAV per share drops far enough to generate a loss on generated shares. BWG fit the bill and I ended up buying.
BWG "seeks current income with a secondary investment objective of capital appreciation." The fund utilizes leverage and provides a "flexible portfolio that targets sovereign debt of developed and emerging market counties, U.S. and non-U.S> corporate debt, mortgage-backed securities and current exposure."
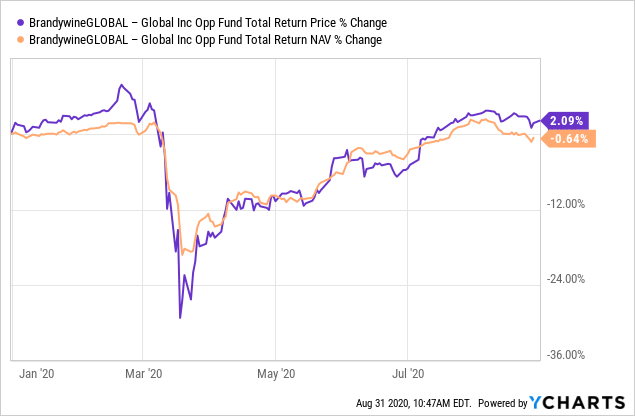
This means that they are essentially a multisector bond fund. Some of their largest positions actually include U.S. Treasury bonds too. This has worked out tremendously well this year and is why the fund is basically flat for the year. Even as other bond funds are struggling like some of the highly regarded PIMCO fixed-income funds. Those Treasury holdings helped balance out the MBS that they have exposure to as well.
The fund is a fair size at around $439 million in managed assets. Their leverage is composed of loans and preferred shares. It also looks like they leave a line available for reverse repos as a form of raising leverage too. To reference the PIMCO funds again, that is a common form of leverage they utilize.
The total expense ratio of the fund is 3.11%, but that also includes interest expenses of 1.10%. Leaving the management fees and operational expenses of around 2%, which seems high. However, consider that they invest in a global and varied portfolio.
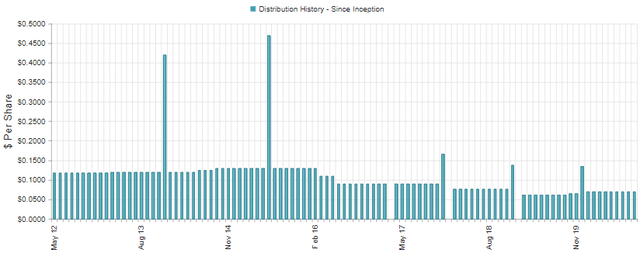
The current distribution rate is $0.07 a month per share. That works out to 6.82% currently. The fund has had both adjustments up and down since its inception.
(Source - CEFConnect)
ASA Gold and Precious Metals (ASA)
This one is a completely speculative trade. It doesn't fit with my general investing objective. The reason this is even riskier than usual is the significant run-up the fund has already had this year. The primary play is that investors keep up the momentum and bid this higher. I think investors need a few speculative positions in their portfolio to keep things interesting in investing.
This is also a very small position - less than half a percent of my portfolio. My exit would come if it doubles - which is a lofty expectation as it has already done that this year from the lows. I would also look to trim if it hits a 20% to 30% or so gain. I would also exit if we enter a correction and something more attractive presents itself. Potentially meaning that I would sell this position at a loss if need be.
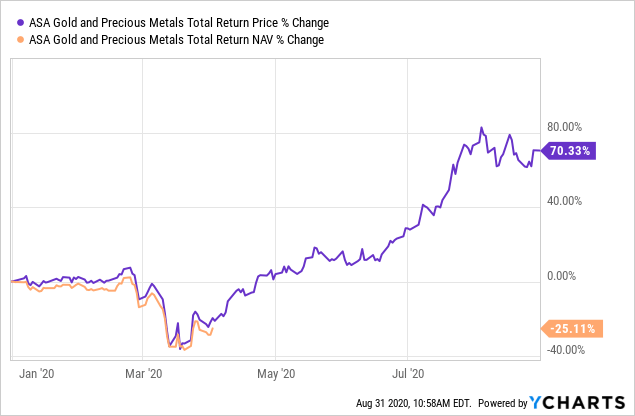
The total NAV return of the fund on a YTD basis, as of 7/31/2020 according to CEFConnect is 57.75%. As we can see, it has made a tremendous move and that is why it is rather risky to jump in now. As previously mentioned though, it is a small position.
The reason for this move is the fund's investment policy; "at least 80% of its total assets must be (i) invested in common shares or securities convertible into common shares of companies engaged, directly or indirectly, in the exploration, mining or processing of gold, silver, platinum, diamonds or other precious minerals, (ii) held as bullion or other direct forms of gold, silver, platinum or other precious minerals, (iii) invested in instruments representing interests in gold, silver, platinum or other precious minerals such as certificates of deposit therefor, and/or (iv) invested in securities of investment companies, including exchange-traded funds, or other securities that seek to replicate the price movement of gold, silver or platinum bullion."
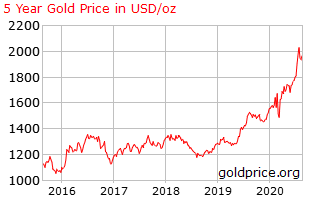
The price of gold had been on an incredible run, pushing over $2000 per ounce at one point. Gold is generally considered to be a safe haven during times of panic. As a commodity, it can also be a bit of a hedge against inflation. Although, some economists say gold isn't surging higher on inflation expectations alone.
(Source: Goldprice)
That, in turn, had pushed up the price of the mining companies. ASA's top 5 holdings are Orla Mining (OLA), Agnico Eagle Mines (AEM), AngloGold Ashanti (ANG), Barrick Gold Corp. (GOLD) and Endeavour Mining (EDV). OLA and EDV trade on the Toronto Stock Exchange, and ANG trades on the Johannesburg Stock Exchange. ANG trades on the NYSE in the U.S. as ticker AU and EDV also trades in the U.S. OTC as OTCQX:EDVMF. Additionally, OLA also trades OTC in the U.S. as OTC:ORRLF.
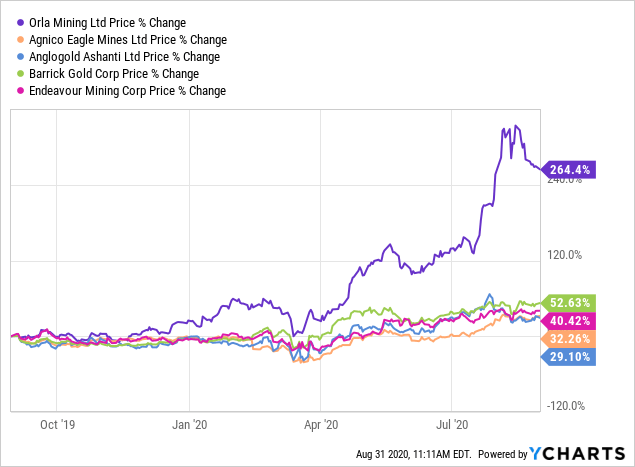
On a YTD basis, these positions have really been tremendous. Though the most notable has been OLA. It happens to be ASA's largest holding as well. What makes OLA interesting is that itself is highly speculative in that it hasn't even started production yet! Near the end of 2019, they secured funding for the development of a facility. They are hoping to have their first gold production in mid-2021 if all goes well.
For ASA itself, the fund manages just over $517 million in total assets. They don't utilize leverage either. Which makes sense as their underlying positions can be quite volatile on their own. The distribution isn't much to talk about either, as they currently pay a token $0.01 semi-annually.
(Source: CEFConnect)
Conclusion
KMF and OXLC were in my portfolio previously, I just added to these positions. For BWG and ASA, these were new additions to my portfolio. I believe KMF's strategy change will benefit the fund tremendously going forward. OXLC is a bit of a speculation and high risk. BWG is a solid fund, adding in the potential to profit from the tender offer is just a "bonus." ASA is purely speculation in my eyes as the fund has run up tremendously on gold's rally that boosted gold mining stocks.
Overall, the market appears to be quite lofty - especially if you are in tech. Making some small purchases can help increase income over time. However, it doesn't mean that we have to jump all in at these current levels. Keeping some cash around for the next pullback or correction makes a lot of sense here.
Profitable CEF and ETF income and arbitrage ideas
 At the CEF/ETF Income Laboratory, we manage ~8%-yielding closed-end fund (CEF) and exchange-traded fund (ETF) portfolios to make income investing easy for you. Check out what our members have to say about our service.
To see all that our exclusive membership has to offer, sign up for a free trial by clicking on the button below!

Disclosure: I am/we are long ASA, BWG, HD, KMF, OXLC, OXLCP, SZC. I wrote this article myself, and it expresses my own opinions. I am not receiving compensation for it (other than from Seeking Alpha). I have no business relationship with any company whose stock is mentioned in this article.
Additional disclosure: This article was originally published on September 1st, 2020 to members of the CEF/ETF Income Laboratory


